

Question: I need help with question 7 please. I need please with question 7 please. the wong lace estefnur reformal stockt - and PRC indes. Ce
 I need help with question 7 please.
 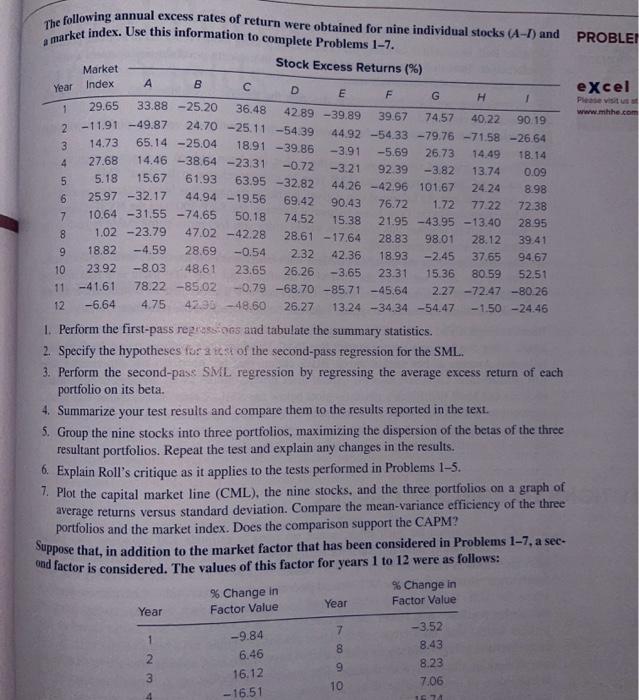 I need please with question 7 please.
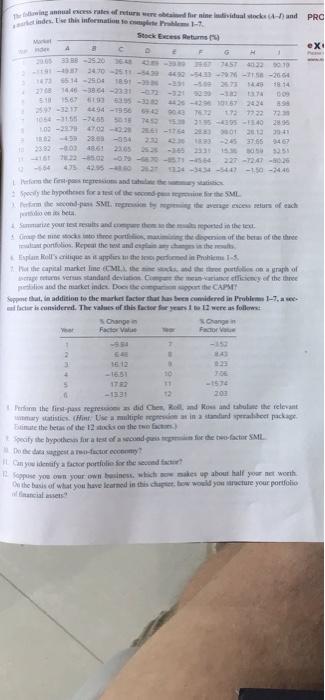
 the wong lace estefnur reformal stockt - and PRC indes. Ce this informato 1-7 Stock Exceturns 4 ext D. E F G 1 33 B-2520 JE 55 7457 4022 5010 340-2511-540-543-18-20-6 514-2500 1891 - 350 273 1814 04463064-2231-072-3202-10 DOS 1567315-30 -1.67 2434 39 1217 94 - 1950 904 173722 1056 -11.61-74055015 725 55-1340 10-27 70322 26-1152430 2010 30-1 28.03-054 253765 23.02 1861 2365-15 2 - 503 227-72.47 - 42552 1234-344-54-1.50 -2440 fone dei secondo Spolythe bypothes for the second perhe som de wond SM te wenge cu elus of each Saise your test and there in the te opened to the the dispersion of the berm of the three portfolio Repeat the end is the spam Rolls que post the precedin Prahom the capital market Ime Madhe people of en verstandard detection of the three and the marketindes. Dooth the CAPS Sept. In addition to the market factor that has been comidered in Problem 1-1.a mich is considerunt. The values of this factors were as follows: Change change Factor Factor 7 2 1 15-12 1651 10 5 172 11 200 in the first pas regressions did Cher Rolland and the the relevant try statistics. Use a multiple din tand eralibet package But the beas of the 12 is on the the pay the hypothes for test of secundario de facto SML De esta teo-factor economy any identify a factor portfolio Sorte con pe you own your own business, which was up about half your net worth On the basis or what you have learned in this case would you recture your portfolio cias PROBLEI Year excel Please visit www.mhhe.com 1 36.48 42.89-39.89 24.70 -25.11 -54.39 The following annual excess rates of return were obtained for nine individual stocks (A-1) and a market index. Use this information to complete Problems 1-7. Stock Excess Returns (%) Market Index B D E F G H 1 29.65 33.88 -25.20 39.67 7457 40.22 90.19 2 -11.91 -49.87 44.92-54.33 -79.76 -71.58 -26.64 3 14.73 65.14 -25.04 18.91 -39.86 -3.91 -5.69 26.73 14.49 18.14 4 27.68 14.46 -38.64 -23.31 -0.72 -3.21 92.39 -3.82 13.74 0.09 5 5.18 15.67 61.93 63.95 -32.82 44.26 -42.96 101.67 24.24 8.98 6 25.97 -32.17 44.94-19.56 90.43 76.72 1.72 77.22 7238 7 10.64 -31.55-74.65 50.18 15.38 21.95 -43.95 -13.40 28.95 8 1.02-23.79 47.02-42.28 28.61 -17.64 28.83 98.01 28.12 39.41 9 18.82 -4.59 28.69 -0.54 2.32 42.36 18.93 -2.45 37.65 94.67 10 23.92 -8.03 48.61 23.65 26.26 -3.65 23.31 15.36 80.59 52.51 11 -41.61 78.22-85.02 -0.79-68.70-85.71 -45.64 2.27 -72.47 -80.26 12 -6.64 4.75 42.90 -48.60 26.27 13.24 -34.34 -54.47 -1.50 -24.46 69.42 74.52 1. Perform the first-pass regressions and tabulate the summary statistics. 2. Specify the hypotheses for 2 est of the second-pass regression for the SML. 3. Perform the second-pase SML regression by regressing the average excess return of each portfolio on its beta 4. Summarize your test results and compare them to the results reported in the text. 5. Group the nine stocks into three portfolios, maximizing the dispersion of the betas of the three resultant portfolios. Repeat the test and explain any changes in the results. 6. Explain Roll's critique as it applies to the tests performed in Problems 1-5. 7. Plot the capital market line (CML), the nine stocks, and the three portfolios on a graph of average returns versus standard deviation. Compare the mean-variance efficiency of the three portfolios and the market index. Does the comparison support the CAPM? Suppose that, in addition to the market factor that has been considered in Problems 1-7, a sec- ond factor is considered. The values of this factor for years 1 to 12 were as follows: % Change in % Change in Factor Value Factor Value -3.52 -9.84 8.43 8.23 10 7.06 Year Year 7 1 2 3 6.46 16.12 -16.51 00:00 1974 the wong lace estefnur reformal stockt - and PRC indes. Ce this informato 1-7 Stock Exceturns 4 ext D. E F G 1 33 B-2520 JE 55 7457 4022 5010 340-2511-540-543-18-20-6 514-2500 1891 - 350 273 1814 04463064-2231-072-3202-10 DOS 1567315-30 -1.67 2434 39 1217 94 - 1950 904 173722 1056 -11.61-74055015 725 55-1340 10-27 70322 26-1152430 2010 30-1 28.03-054 253765 23.02 1861 2365-15 2 - 503 227-72.47 - 42552 1234-344-54-1.50 -2440 fone dei secondo Spolythe bypothes for the second perhe som de wond SM te wenge cu elus of each Saise your test and there in the te opened to the the dispersion of the berm of the three portfolio Repeat the end is the spam Rolls que post the precedin Prahom the capital market Ime Madhe people of en verstandard detection of the three and the marketindes. Dooth the CAPS Sept. In addition to the market factor that has been comidered in Problem 1-1.a mich is considerunt. The values of this factors were as follows: Change change Factor Factor 7 2 1 15-12 1651 10 5 172 11 200 in the first pas regressions did Cher Rolland and the the relevant try statistics. Use a multiple din tand eralibet package But the beas of the 12 is on the the pay the hypothes for test of secundario de facto SML De esta teo-factor economy any identify a factor portfolio Sorte con pe you own your own business, which was up about half your net worth On the basis or what you have learned in this case would you recture your portfolio cias PROBLEI Year excel Please visit www.mhhe.com 1 36.48 42.89-39.89 24.70 -25.11 -54.39 The following annual excess rates of return were obtained for nine individual stocks (A-1) and a market index. Use this information to complete Problems 1-7. Stock Excess Returns (%) Market Index B D E F G H 1 29.65 33.88 -25.20 39.67 7457 40.22 90.19 2 -11.91 -49.87 44.92-54.33 -79.76 -71.58 -26.64 3 14.73 65.14 -25.04 18.91 -39.86 -3.91 -5.69 26.73 14.49 18.14 4 27.68 14.46 -38.64 -23.31 -0.72 -3.21 92.39 -3.82 13.74 0.09 5 5.18 15.67 61.93 63.95 -32.82 44.26 -42.96 101.67 24.24 8.98 6 25.97 -32.17 44.94-19.56 90.43 76.72 1.72 77.22 7238 7 10.64 -31.55-74.65 50.18 15.38 21.95 -43.95 -13.40 28.95 8 1.02-23.79 47.02-42.28 28.61 -17.64 28.83 98.01 28.12 39.41 9 18.82 -4.59 28.69 -0.54 2.32 42.36 18.93 -2.45 37.65 94.67 10 23.92 -8.03 48.61 23.65 26.26 -3.65 23.31 15.36 80.59 52.51 11 -41.61 78.22-85.02 -0.79-68.70-85.71 -45.64 2.27 -72.47 -80.26 12 -6.64 4.75 42.90 -48.60 26.27 13.24 -34.34 -54.47 -1.50 -24.46 69.42 74.52 1. Perform the first-pass regressions and tabulate the summary statistics. 2. Specify the hypotheses for 2 est of the second-pass regression for the SML. 3. Perform the second-pase SML regression by regressing the average excess return of each portfolio on its beta 4. Summarize your test results and compare them to the results reported in the text. 5. Group the nine stocks into three portfolios, maximizing the dispersion of the betas of the three resultant portfolios. Repeat the test and explain any changes in the results. 6. Explain Roll's critique as it applies to the tests performed in Problems 1-5. 7. Plot the capital market line (CML), the nine stocks, and the three portfolios on a graph of average returns versus standard deviation. Compare the mean-variance efficiency of the three portfolios and the market index. Does the comparison support the CAPM? Suppose that, in addition to the market factor that has been considered in Problems 1-7, a sec- ond factor is considered. The values of this factor for years 1 to 12 were as follows: % Change in % Change in Factor Value Factor Value -3.52 -9.84 8.43 8.23 10 7.06 Year Year 7 1 2 3 6.46 16.12 -16.51 00:00 1974
Step by Step Solution
There are 3 Steps involved in it

Get step-by-step solutions from verified subject matter experts