

Question: I need help with question 8, I have added question 7 because you need that question to answer it. Foundations of Math 11 Unit6 Send-In
I need help with question 8, I have added question 7 because you need that question to answer it.
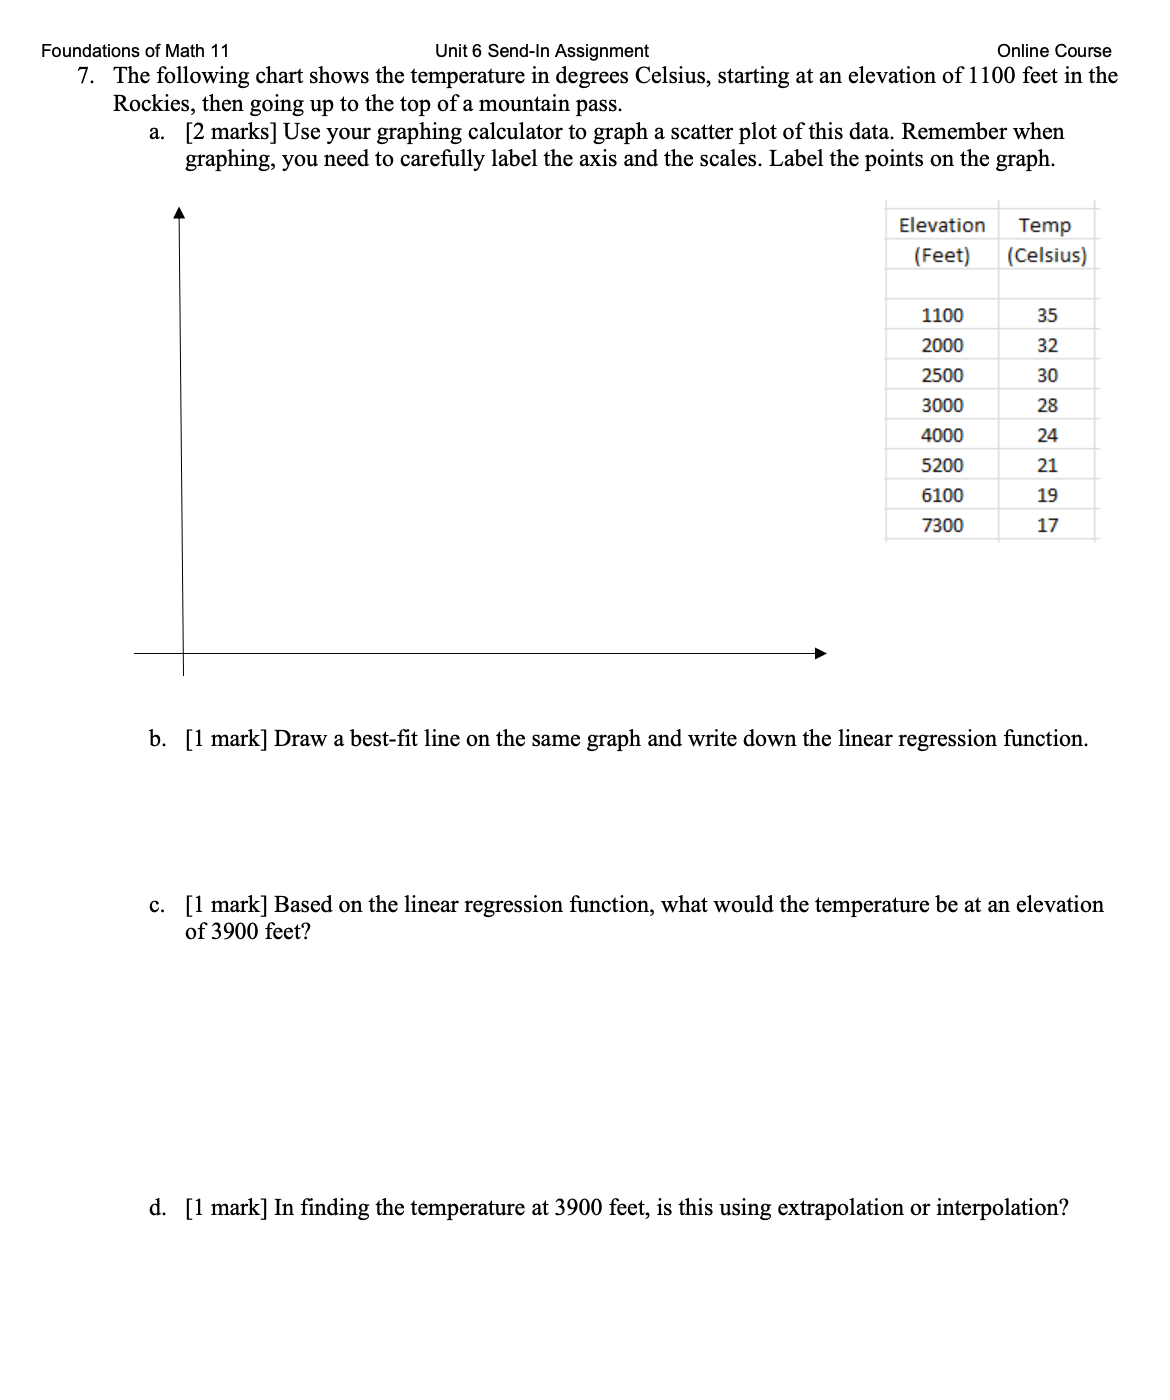
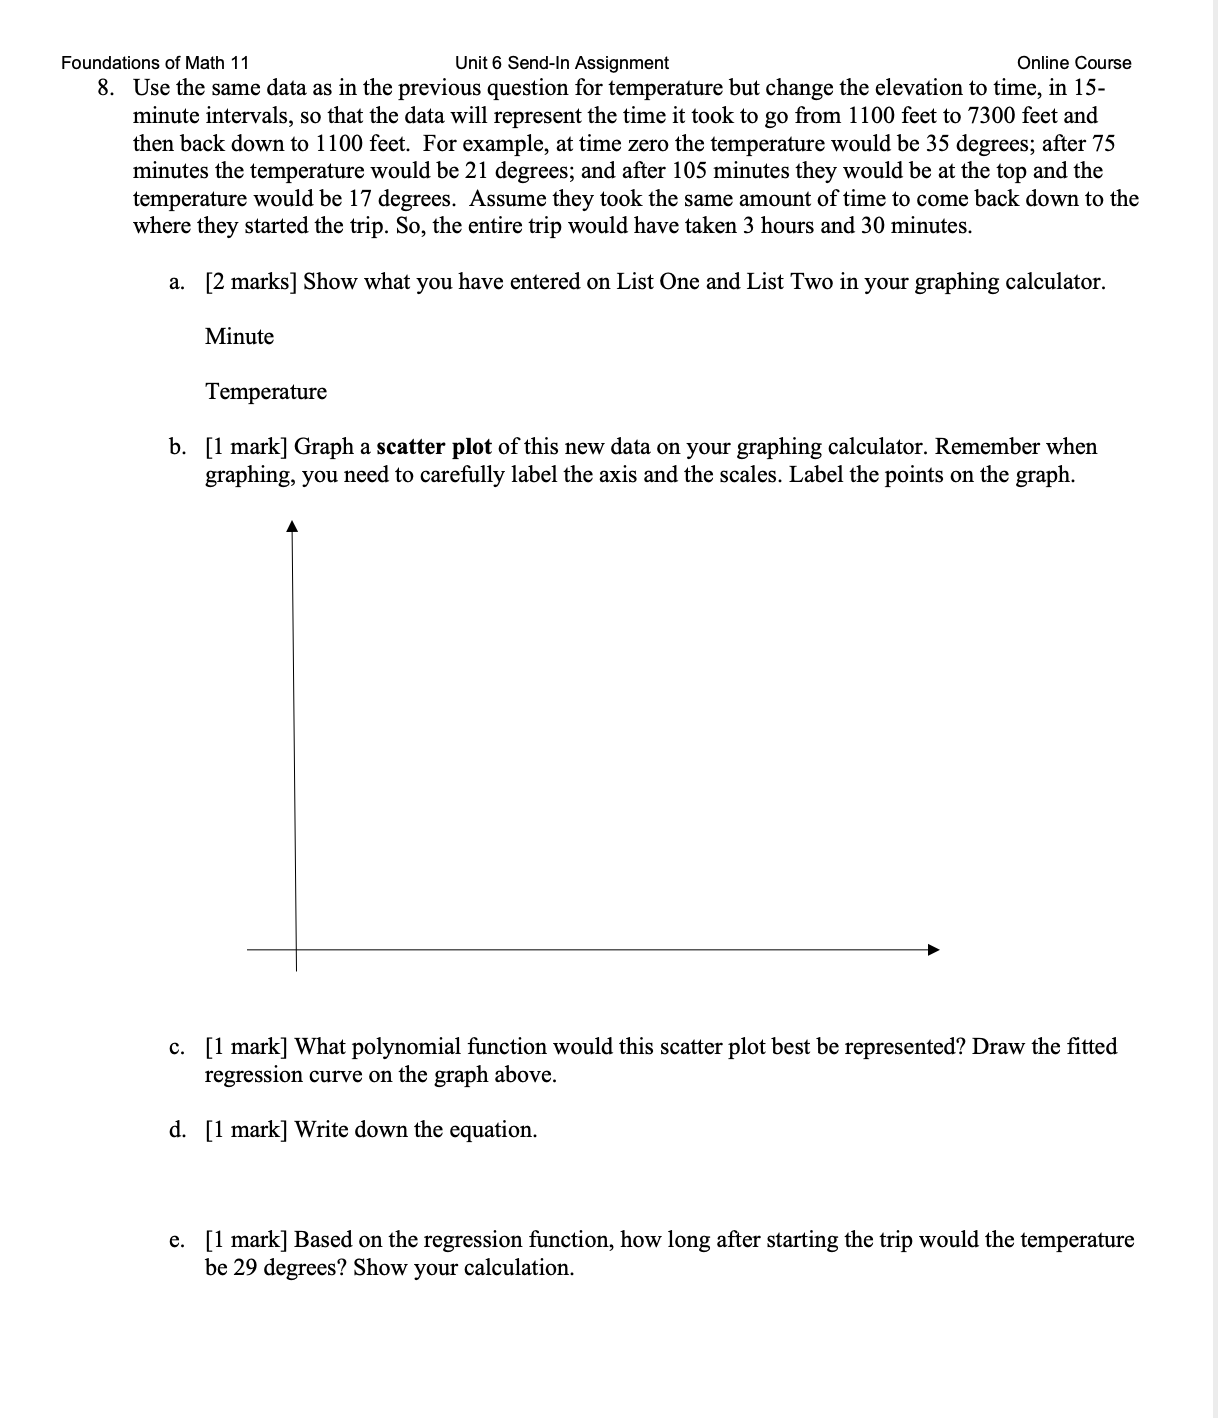
Foundations of Math 11 Unit6 Send-In Assignment Online Course 7'. The following chart shows the temperature in degrees Celsius, starting at an elevation of 1100 feet in the Rockies, then going up to the top of a mountain pass. a. [2 marks] Use your graphing calculator to graph a scatter plot of this data. Remember when graphing, you need to carefully label the axis and the scales. Label the points on the graph. T Elevation Temp [Feet] {Celsius} 1100 35 2000 32 2500 30 3000 28 4000 24 5200 21 6100 19 7300 17 b. [1 mark] Draw a best-t line on the same graph and write down the linear regression function. c. [1 mark] Based on the linear regression function, what would the temperature be at an elevation of 3900 feet? d. [1 mark] In nding the temperature at 3900 feet, is this using extrapolation or interpolation? Foundations of Math 11 Unit6 Send-In Assignment Online Course 8. Use the same data as in the previous questirm for temperature but change the elevation to time, in 15- minute intervals, so that the data will represent the time it took to go from 1100 feet to 7300 feet and then back down to l 100 feet. For example, at time zero the temperature would be 35 degrees; after 75 minutes the temperature would be 21 degrees; and after 105 minutes they would be at the top and the temperature would be 17 degrees. Assume they took the same amount of time to come back down to the where they started the trip. So, the entire trip would have taken 3 hours and 30 minutes. a. [2 marks] Show what you have entered on List One and List Two in your graphing calculator. Minute Temperature b. [1 mark] Graph a scatter plot of this new data on your graphing calculator. Remember when graphing, you need to carefully label the axis and the scales. Label the points on the graph. f % c. [1 mark] What polynomial rnction would this scatter plot best be represented? Draw the tted regression curve on the graph above. d. [1 mark] Write down the equation. e. [1 mark] Based on the regression function, how long after starting the trip would the temperature be 29 degrees? Show your calculation
Step by Step Solution
There are 3 Steps involved in it

Get step-by-step solutions from verified subject matter experts