

Question: I need help with required 2 and 3. Tableau Dashboard Activity 6-1 (Statle) Evaluating Sales and Gross Profit Percentage [LO 6-6] Friends & Family Funland
![6-1 (Statle) Evaluating Sales and Gross Profit Percentage [LO 6-6] Friends &](https://dsd5zvtm8ll6.cloudfront.net/si.experts.images/questions/2024/09/66fb2f81ae797_72866fb2f8098fb7.jpg)
I need help with required 2 and 3.
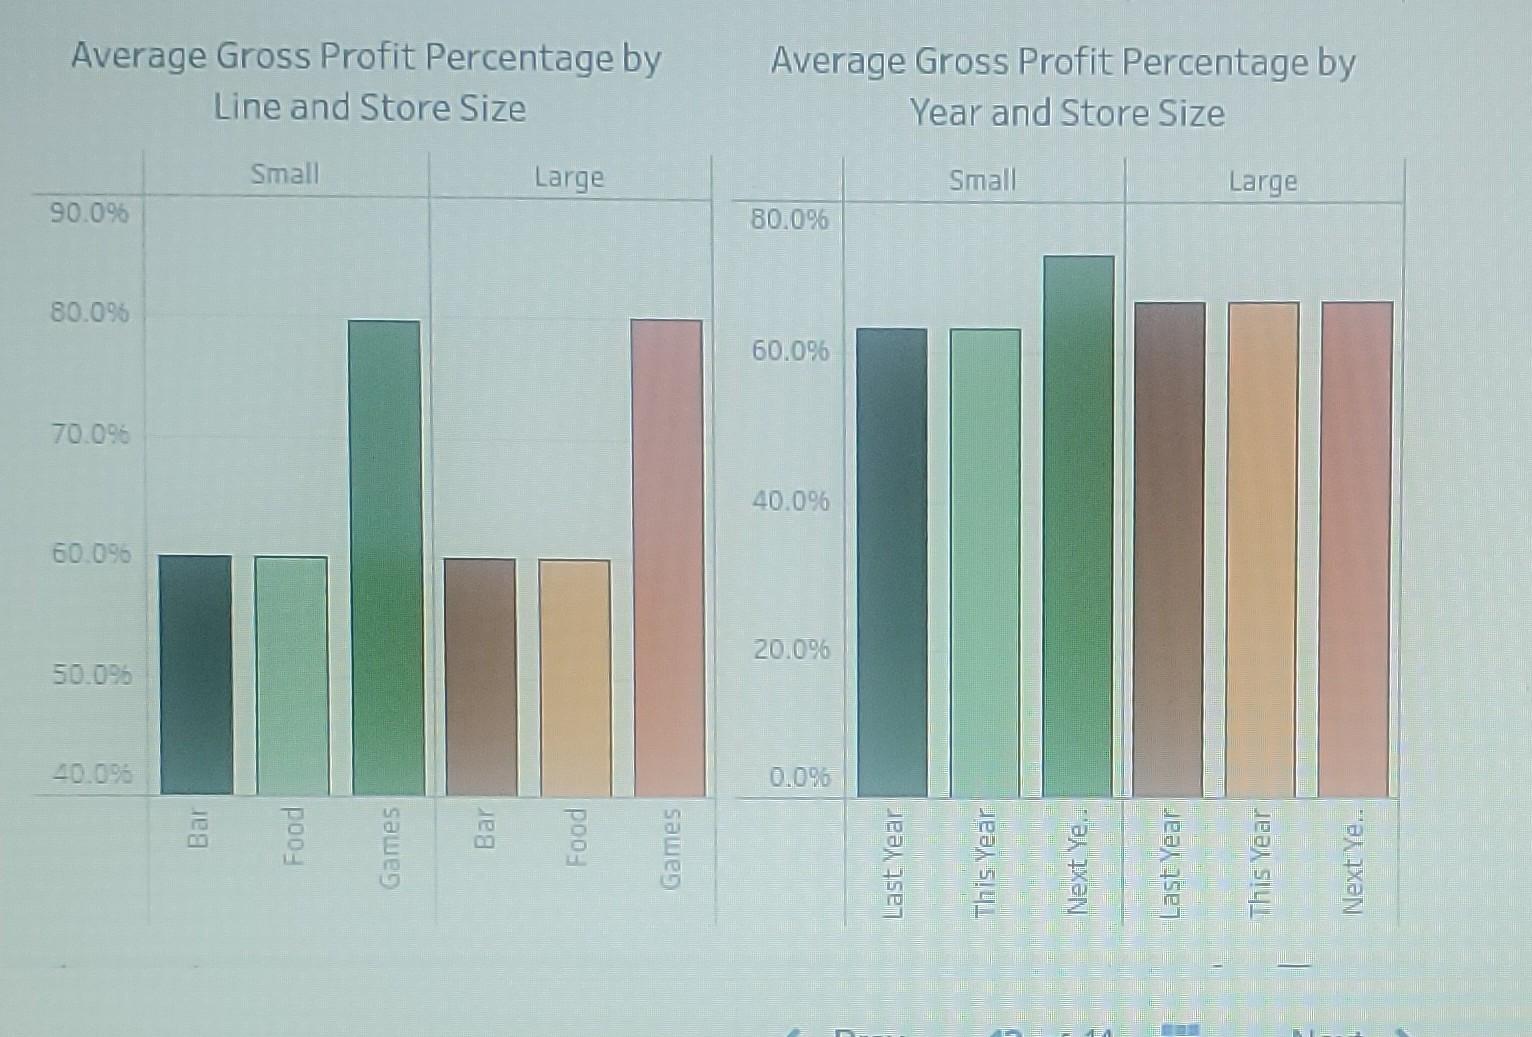
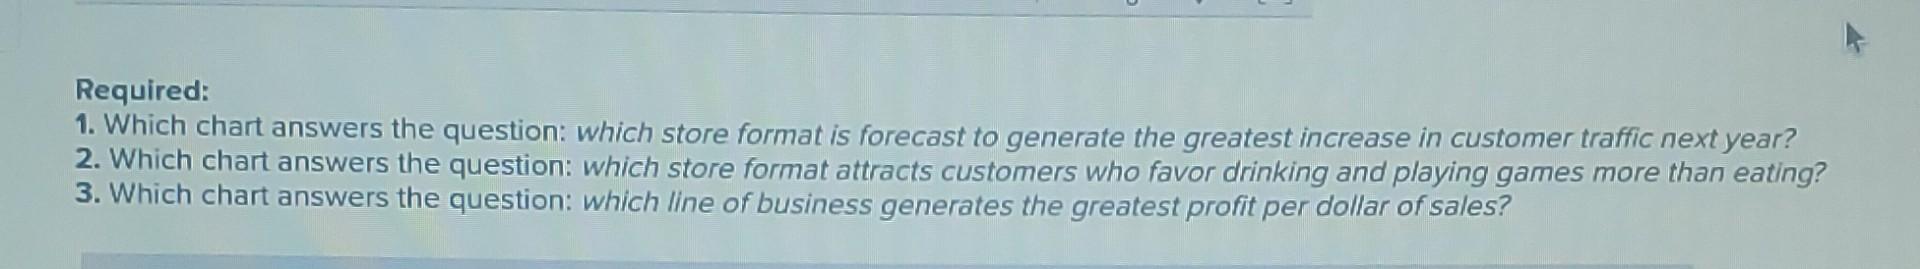
Tableau Dashboard Activity 6-1 (Statle) Evaluating Sales and Gross Profit Percentage [LO 6-6] Friends & Family Funland (FFF) operates entertainment venues that sell food, drinks, and midway-style games throughout the country. FFF began with only large venues in larger cities, but in the past five years has been adding small venues in smaller cities. All venues offer a range of food, drinks, and games. FFF's executives are seeking financing for future expansion of the small venue format. At a recent investor presentation, FFF provided financial data by product line and store format for last year, this year, and next year (forecast). FFF reports revenue at the amount it charges customers for food, drinks, and game services, and cost of goods sold includes FFF's costs of food, beverages, and midway-game prizes provided to customers. The Tableau dashboard below shows annual sales revenue and gross profit percentage by year, line of business, and location size. For each of the following questions, your task is to identify the applicable chart that can be used to answer the question asked. Sales by Business Line and Store Size Sales by Year and Store Size Small Large Small Large Sales by Business Line and Store Size Sales by Year and Store Size Small Large Small Large $100,000 $60,000 $80,000 $50,000 $40,000 $60,000 $30,000 $40,000 $20,000 $20,000 $10,000 so so saweg Last Year This Year Next Ye. Last Year This Year Next Ye.. Average Gross Profit Percentage by Line and Store Size Average Gross Profit Percentage by Year and Store Size Small Large Small Large 90.0% 80.0% 80.096 60.096 70.096 40.0% 60.096 20.0% 50.00 40.096 0.098 Bar Games Food Games Required: 1. Which chart answers the question: which store format is forecast to generate the greatest increase in customer traffic next year? 2. Which chart answers the question: which store format attracts customers who favor drinking and playing games more than eating? 3. Which chart answers the question: which line of business generates the greatest profit per dollar of sales
Step by Step Solution
There are 3 Steps involved in it

Get step-by-step solutions from verified subject matter experts