

Question: I NEED HELP WITH SEENING HOW THE GRAPH NEEDS TO LOOK LIKE! THANK YOU! Use the security returns below, to answer the following questions. Assume
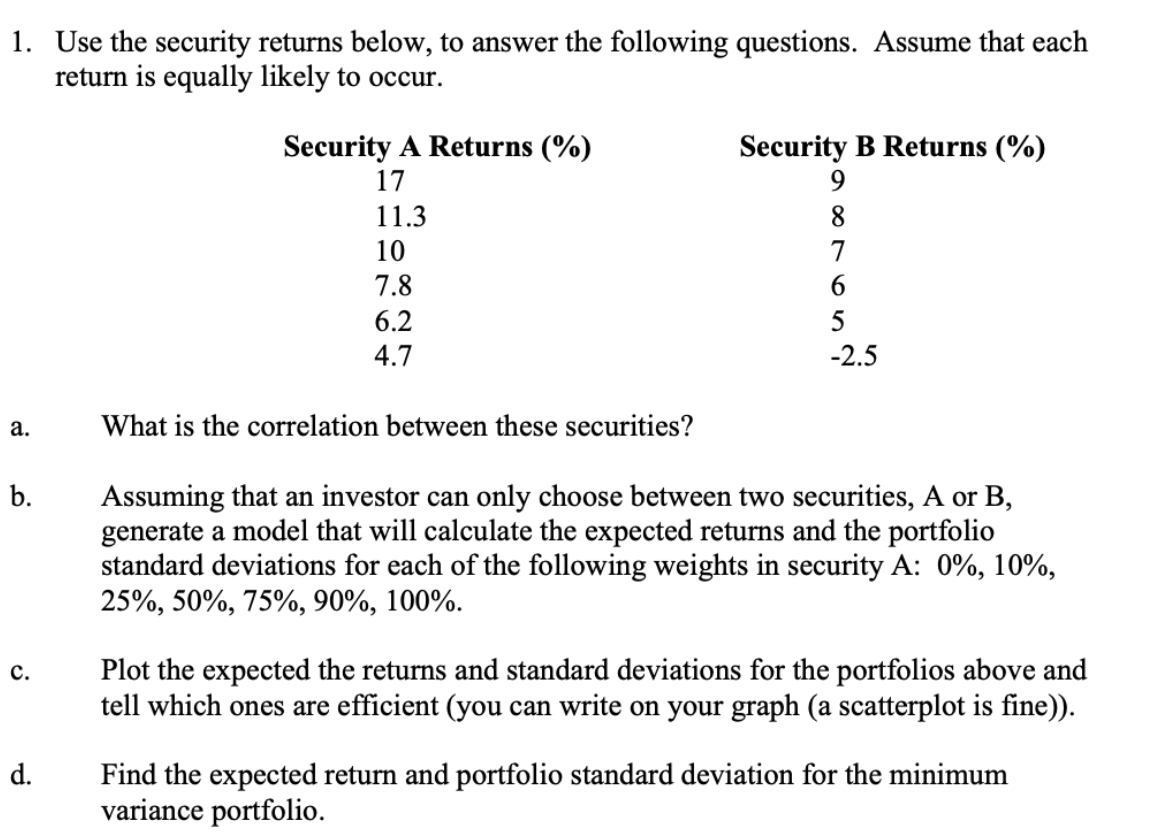
I NEED HELP WITH SEENING HOW THE GRAPH NEEDS TO LOOK LIKE! THANK YOU! Use the security returns below, to answer the following questions. Assume that each
return is equally likely to occur.
a What is the correlation between these securities
b Assuming that an investor can only choose between two securities A or B
generate a model that will calculate the expected returns and the portfolio
standard deviations for each of the following weights in security :
c Plot the expected the returns and standard deviations for the portfolios above and
tell which ones are efficient you can write on your graph a scatterplot is fine
d Find the expected return and portfolio standard deviation for the minimum
variance portfolio.
Step by Step Solution
There are 3 Steps involved in it
1 Expert Approved Answer
Step: 1 Unlock

Question Has Been Solved by an Expert!
Get step-by-step solutions from verified subject matter experts
Step: 2 Unlock
Step: 3 Unlock