

Question: I need help with solving this question. Income Consumption Saving Investment Government Net Export Aggregate (Yd) Expenditure (5) Expenditure Expenditure Expenditure Expenditure (C) (1) (G)
I need help with solving this question.
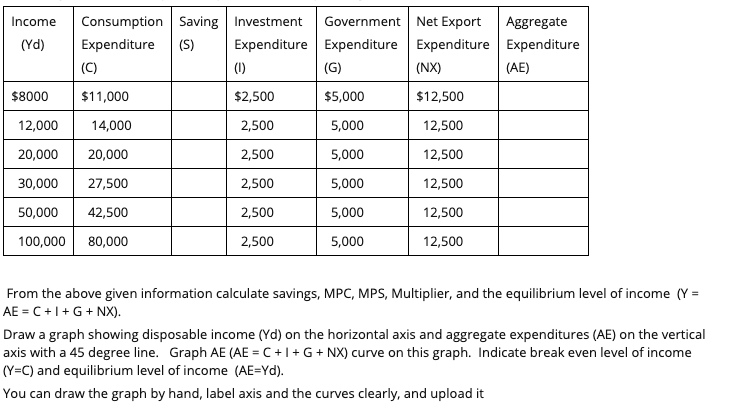
Income Consumption Saving Investment Government Net Export Aggregate (Yd) Expenditure (5) Expenditure Expenditure Expenditure Expenditure (C) (1) (G) (NX) (AE) $8000 $11,000 $2,500 $5,000 $12,500 12,000 14,000 2,500 5,000 12,500 20,000 20,000 2,500 5,000 12,500 30,000 27,500 2,500 5,000 12,500 50,000 42,500 2,500 5,000 12,500 100,000 80,000 2,500 5,000 12,500 From the above given information calculate savings, MPC, MPS, Multiplier, and the equilibrium level of income (Y = AE = C + I+ G + NX). Draw a graph showing disposable income (Yd) on the horizontal axis and aggregate expenditures (AE) on the vertical axis with a 45 degree line. Graph AE (AE = C + 1 + G + NX) curve on this graph. Indicate break even level of income (Y=C) and equilibrium level of income (AE=Yd). You can draw the graph by hand, label axis and the curves clearly, and upload it
Step by Step Solution
There are 3 Steps involved in it

Get step-by-step solutions from verified subject matter experts