

Question: i need help with stats 6. [4/6 Points] DETAILS PREVIOUS ANSWERS MY NOTES ASK YOUR TEACHER PRACTICE ANOTHER The survey asked students if they preferred
i need help with stats
![i need help with stats 6. [4/6 Points] DETAILS PREVIOUS ANSWERS MY](https://dsd5zvtm8ll6.cloudfront.net/si.experts.images/questions/2024/10/6708b1eed6a5d_0866708b1eeb3992.jpg)
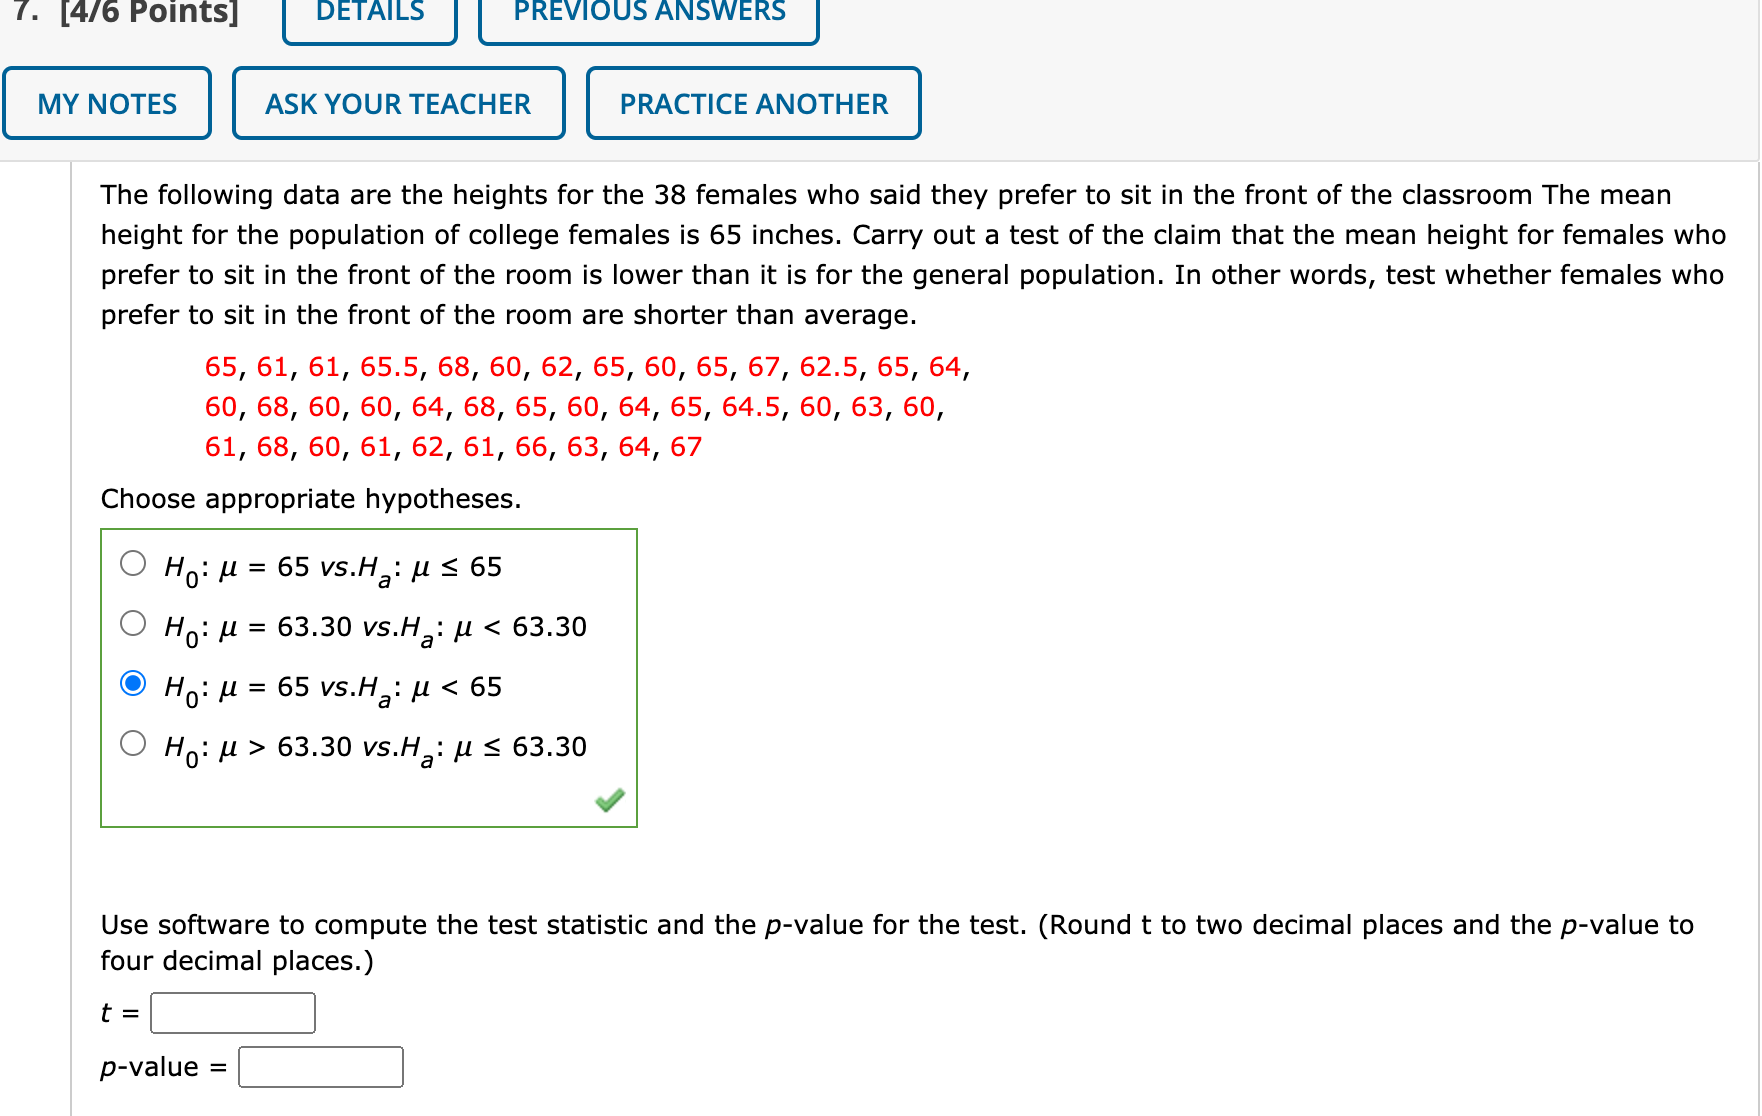
6. [4/6 Points] DETAILS PREVIOUS ANSWERS MY NOTES ASK YOUR TEACHER PRACTICE ANOTHER The survey asked students if they preferred to sit in the front, middle, or back of the class and also asked them their heights. The following data are the heights for 15 female students who said they prefer to sit in the back of the class. The mean height for the population of college females is 65 inches. Carry out a test of the claim that the mean height for females who prefer to sit in the back of the room is higher than it is for the general population. In other words, test whether females who prefer to sit in the back of the room are taller than average. 68, 62, 65, 69, 68, 69, 64, 66, 69, 68, 62, 64, 67, 68, 65 Choose appropriate hypotheses. O H: M = 65 vs.H: U > 65 O Ho: M > 66.27 vs.H: M 2 66.27 O Ho: M = 65 vs.Ha: M 2 65 O H: M = 66.27 VS.H: M > 66.27 Use software to compute the test statistic and the p-value for the test. (Round t to two decimal places and the p-value to four decimal places.) t = p-value = Choose an appropriate conclusion for this test. O Do not reject the null hypothesis and conclude that the mean height for women who prefer to sit in the back of7. [4/6 Points] I DETAILS ll PREVIOUSANSWERS I MY NOTES ASK YOUR TEACHER PRACTICE ANOTHER The following data are the heights for the 38 females who said they prefer to sit in the front of the classroom The mean height for the population of college females is 65 inches. Carry out a test of the claim that the mean height for females who prefer to sit in the front of the room is lower than it is for the general population. In other words, test whether females who prefer to sit in the front of the room are shorter than average. 55, 51, 51, 55.5, 68, 5o, 52, 55, 5o, 55, 57, 52.5, 55, 54, 50, 5s, 50, 5o, 54, 68, 55, 5o, 54, 55, 54.5, 50, 53, 5o, 51, 68,60, 51, 52, 51, 55, 53, 54, 57 Choose appropriate hypotheses. O Ho: ,u = 65 vs.Ha: p S 65 O HO: ,u = 53.30 vs.Ha: [.1 63.30 vs.Ha: p 5 63.30 J Use software to compute the test statistic and the p-value for the test. (Round t to two decimal places and the p-value to four decimal places.) t = I: p-value =
Step by Step Solution
There are 3 Steps involved in it

Get step-by-step solutions from verified subject matter experts