

Question: I need help with steps 10-17. please help me with specific formulas and exactly what cells go in the formulas. 10. In cell B28, calculate

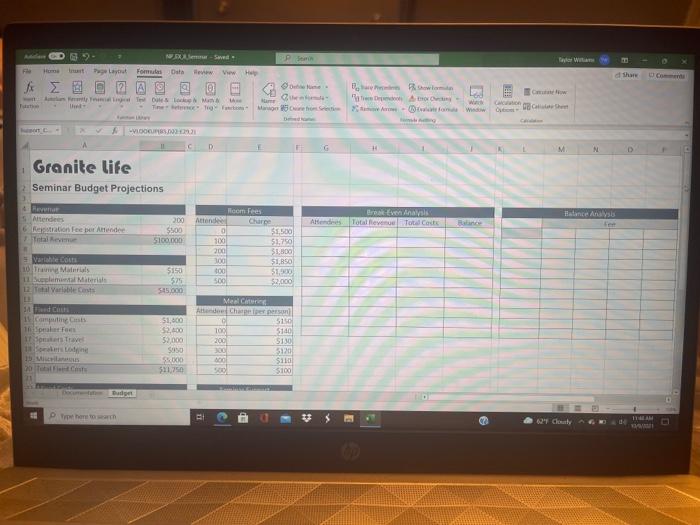
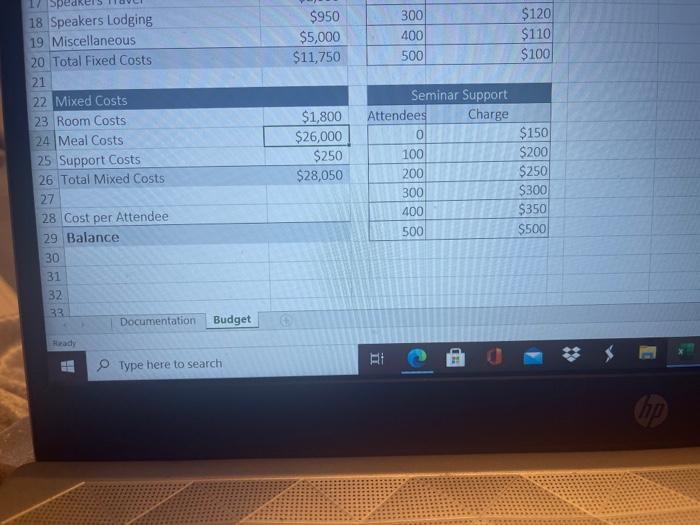
10. In cell B28, calculate the cost per attendee by dividing the sum of the variable costs (cell B12) fixed costs (cell B20), and mixed costs (cell B26) by the number of attendees cell 85). 11. In cell B29, calculate the balance from the conference by subtracting the sum of the variable fixed, and mixed costs from the total revenue (cell B7). 12. Create a one-variable data table of different seminar budgets. In cell G6, display the value of cell B5. In cell H6, display the value of B7. In cell 16, display the sum of cells B12. B20, and B26. In cell 16, display the value of cell B29. In the range G7 G16, enter the number of possible attendees ranging from 50 to 500 in increments of 50. Complete the data table with cell BS the column input cell, showing the total revenue, total costs, and balance under different numbers of attendees. 13. Create a CVP chart of the Total Revenue and Total Costs values using the data from the range G5:116, the one-variable table, and then format the chart as follows: a. Move and resize the chart to cover the range G18:129. b. Change the chart title to CVP Analysis c. Change the scale of the horizontal axis to go from 0 to 500 in 100-unit increment 14. Brenda wants to investigate the impact of different registration fees and number of attendees on the seminar balance. In cell L6, display the value of cell B29 formatted to display the text Attendees. In the range L7:116, enter attendee values ranging from 50 to 500 in intents of 50. In the range M6:P6, enter registration fees of $200 $300, $400, and $500. 15. Create a two-variable data table in the range 16:P16, using cell B6 as the row inputs and cell B5 as the column input cell 16. Create a scatter chart with straight lines of the data in the range L7:P16, and then the fol lowing changes to the chart: a. Move and resize the chart to cover the range L18:P29. b. Change the chart title to Balance Analysis. Change the name of the four data series to match the registration fee values in cells M6, N6, OG and P6 d. Change the scale of the horizontal axis to go from 0 to 500 in 100-unit increments. 17. Create scenarios for the other possible values for the input cells listed in Figure 8-48. CHALLENGE Save F Page Layout Shar & Fom Data He View H woman e Dites FA TF Mao 25 Si Cm W Ohm LOCURI D F G . Granite life 2 Seminar Budget Projections Breyer Anaal And Totallevene Tote Code Balance Analysis Het Attendees Reputation fee pret Attendee Total Rem 200 $500 S100.000 Room Fees Attende Charge $1.500 100 51.750 200 $1,800 100 $1,650 300 51 500 $2.000 Variable co 10 Tram Manis 11 Suplemental Materials 2. Total Warble 5150 528 $15.000 3d Cn Speat Fees on Travel 1 $1,600 $2.000 52.000 Suso SO $11.750 Meal Cine A Chiper ce 5150 100 5140 200 5130 300 5120 $110 500 $100 Dudy Photo - E 11 AM 62 Chay $950 $5,000 $11,750 300 400 500 $120 $110 $100 17 Spe 18 Speakers Lodging 19 Miscellaneous 20 Total Fixed Costs 21 22 Mixed Costs 23 Room Costs 24 Meal Costs 25 Support Costs 26 Total Mixed Costs 27 28 Cost per Attendee 29 Balance 30 31 32 33 Documentation $1,800 $26,000 $250 $28,050 Seminar Support Attendees Charge 0 100 200 300 400 500 $150 $200 $250 $300 $350 $500 Budget Type here to search RI 10. In cell B28, calculate the cost per attendee by dividing the sum of the variable costs (cell B12) fixed costs (cell B20), and mixed costs (cell B26) by the number of attendees cell 85). 11. In cell B29, calculate the balance from the conference by subtracting the sum of the variable fixed, and mixed costs from the total revenue (cell B7). 12. Create a one-variable data table of different seminar budgets. In cell G6, display the value of cell B5. In cell H6, display the value of B7. In cell 16, display the sum of cells B12. B20, and B26. In cell 16, display the value of cell B29. In the range G7 G16, enter the number of possible attendees ranging from 50 to 500 in increments of 50. Complete the data table with cell BS the column input cell, showing the total revenue, total costs, and balance under different numbers of attendees. 13. Create a CVP chart of the Total Revenue and Total Costs values using the data from the range G5:116, the one-variable table, and then format the chart as follows: a. Move and resize the chart to cover the range G18:129. b. Change the chart title to CVP Analysis c. Change the scale of the horizontal axis to go from 0 to 500 in 100-unit increment 14. Brenda wants to investigate the impact of different registration fees and number of attendees on the seminar balance. In cell L6, display the value of cell B29 formatted to display the text Attendees. In the range L7:116, enter attendee values ranging from 50 to 500 in intents of 50. In the range M6:P6, enter registration fees of $200 $300, $400, and $500. 15. Create a two-variable data table in the range 16:P16, using cell B6 as the row inputs and cell B5 as the column input cell 16. Create a scatter chart with straight lines of the data in the range L7:P16, and then the fol lowing changes to the chart: a. Move and resize the chart to cover the range L18:P29. b. Change the chart title to Balance Analysis. Change the name of the four data series to match the registration fee values in cells M6, N6, OG and P6 d. Change the scale of the horizontal axis to go from 0 to 500 in 100-unit increments. 17. Create scenarios for the other possible values for the input cells listed in Figure 8-48. CHALLENGE Save F Page Layout Shar & Fom Data He View H woman e Dites FA TF Mao 25 Si Cm W Ohm LOCURI D F G . Granite life 2 Seminar Budget Projections Breyer Anaal And Totallevene Tote Code Balance Analysis Het Attendees Reputation fee pret Attendee Total Rem 200 $500 S100.000 Room Fees Attende Charge $1.500 100 51.750 200 $1,800 100 $1,650 300 51 500 $2.000 Variable co 10 Tram Manis 11 Suplemental Materials 2. Total Warble 5150 528 $15.000 3d Cn Speat Fees on Travel 1 $1,600 $2.000 52.000 Suso SO $11.750 Meal Cine A Chiper ce 5150 100 5140 200 5130 300 5120 $110 500 $100 Dudy Photo - E 11 AM 62 Chay $950 $5,000 $11,750 300 400 500 $120 $110 $100 17 Spe 18 Speakers Lodging 19 Miscellaneous 20 Total Fixed Costs 21 22 Mixed Costs 23 Room Costs 24 Meal Costs 25 Support Costs 26 Total Mixed Costs 27 28 Cost per Attendee 29 Balance 30 31 32 33 Documentation $1,800 $26,000 $250 $28,050 Seminar Support Attendees Charge 0 100 200 300 400 500 $150 $200 $250 $300 $350 $500 Budget Type here to search RI
Step by Step Solution
There are 3 Steps involved in it

Get step-by-step solutions from verified subject matter experts