

Question: -I need help with Table 8.2 HOMENET KEY ASSUMPTIONS Year 0 1 2 3 4 5 6 7 8 9 10 11 12 13 14
-I need help with Table 8.2
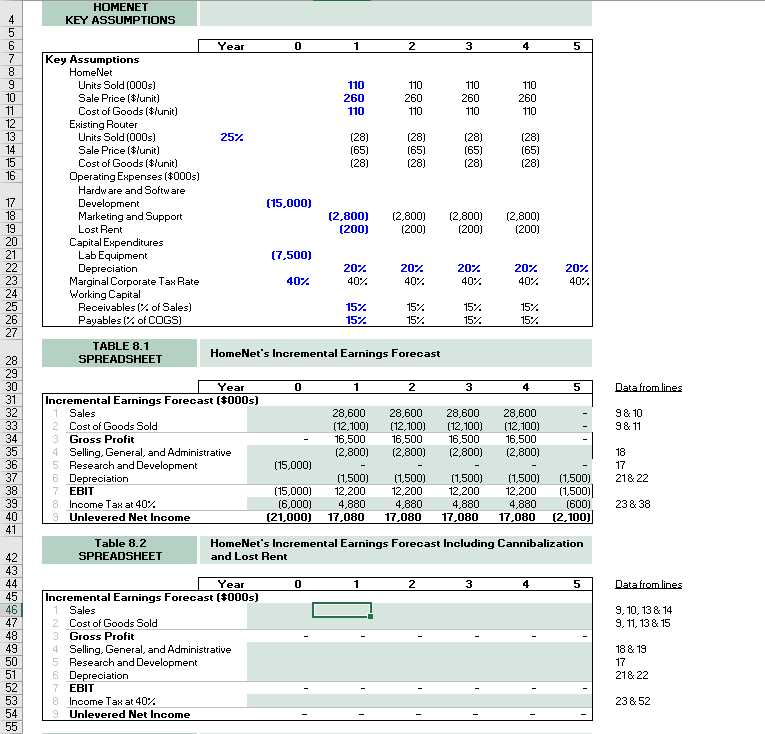
HOMENET KEY ASSUMPTIONS Year 0 1 2 3 4 5 6 7 8 9 10 11 12 13 14 15 16 110 260 110 110 260 110 110 260 110 110 260 110 25% (28) (65) (28) (28) (65) (28) (28) (65) (28) (28) (65) (28) Key Assumptions HomeNet Units Sold(000s) Sale Price ($lunit) Cost of Goods ($lunit) Existing Router Units Sold(000s) Sale Price ($/unit) Cost of Goods ($'unit) Operating Expenses ($000s) Hardware and Software Development Marketing and Support Lost Rent Capital Expenditures Lab Equipment Depreciation Marginal Corporate Tax Rate Working Capital Receivables (% of Sales) Payables (% of COGS) (15,000) (2,800) (200) (2,800) (200) (2,800) (200) (2,800) (200) 17 18 19 20 21 22 23 24 (7,500) 20% 207 40% 207 40% 207 40% 20% 40%. 40% 40% 15% 15% 15% 15% 15%. 15% 15% 15%. 26 27 TABLE 8.1 SPREADSHEET HomeNet's Incremental Earnings Forecast 1 2 3 4 5 Data from lines 9 & 10 9 & 11 28 29 30 31 32 33 34 35 36 37 38 39 40 41 Year 0 Incremental Earnings Forecast ($000s) Sales 2 Cost of Goods Sold 3 Gross Profit 4 Selling, General, and Administrative 5 Research and Development (15,000) 6 Depreciation 7 EBIT (15,000) 8 Income Tax at 40% (6,000) 9 Unlevered Net Income (21,000) 28,600 (12.100) 16,500 (2.800) 28,600 (12,100) 16,500 (2,800) 28,600 (12,100) 16,500 (2,800) 28,600 (12,100) 16,500 (2.800) 18 17 21& 22 (1,500) 12,200 4,880 17,080 (1,500) 12,200 4,880 17,080 (1,500) 12,200 4,880 17,080 (1,500) 12,200 4,880 17,080 (1,500) (1,500) (600) (2,100) 238 38 Table 8.2 SPREADSHEET HomeNet's Incremental Earnings Forecast Including Cannibalization and Lost Rent 0 1 2 3 4 5 Data from lines 9, 10, 13 & 14 9, 11, 13 8 15 42 43 44 45 46 47 48 49 50 51 52 53 54 55 Year Incremental Earnings Forecast ($000s) Sales 2 Cost of Goods Sold 3 Gross Profit 4 Selling, General, and Administrative 5 Research and Development 6 Depreciation 7 EBIT 8 Income Tax at 40% 9 Unlevered Net Income 18 & 19 17 21& 22 23 & 52 HOMENET KEY ASSUMPTIONS Year 0 1 2 3 4 5 6 7 8 9 10 11 12 13 14 15 16 110 260 110 110 260 110 110 260 110 110 260 110 25% (28) (65) (28) (28) (65) (28) (28) (65) (28) (28) (65) (28) Key Assumptions HomeNet Units Sold(000s) Sale Price ($lunit) Cost of Goods ($lunit) Existing Router Units Sold(000s) Sale Price ($/unit) Cost of Goods ($'unit) Operating Expenses ($000s) Hardware and Software Development Marketing and Support Lost Rent Capital Expenditures Lab Equipment Depreciation Marginal Corporate Tax Rate Working Capital Receivables (% of Sales) Payables (% of COGS) (15,000) (2,800) (200) (2,800) (200) (2,800) (200) (2,800) (200) 17 18 19 20 21 22 23 24 (7,500) 20% 207 40% 207 40% 207 40% 20% 40%. 40% 40% 15% 15% 15% 15% 15%. 15% 15% 15%. 26 27 TABLE 8.1 SPREADSHEET HomeNet's Incremental Earnings Forecast 1 2 3 4 5 Data from lines 9 & 10 9 & 11 28 29 30 31 32 33 34 35 36 37 38 39 40 41 Year 0 Incremental Earnings Forecast ($000s) Sales 2 Cost of Goods Sold 3 Gross Profit 4 Selling, General, and Administrative 5 Research and Development (15,000) 6 Depreciation 7 EBIT (15,000) 8 Income Tax at 40% (6,000) 9 Unlevered Net Income (21,000) 28,600 (12.100) 16,500 (2.800) 28,600 (12,100) 16,500 (2,800) 28,600 (12,100) 16,500 (2,800) 28,600 (12,100) 16,500 (2.800) 18 17 21& 22 (1,500) 12,200 4,880 17,080 (1,500) 12,200 4,880 17,080 (1,500) 12,200 4,880 17,080 (1,500) 12,200 4,880 17,080 (1,500) (1,500) (600) (2,100) 238 38 Table 8.2 SPREADSHEET HomeNet's Incremental Earnings Forecast Including Cannibalization and Lost Rent 0 1 2 3 4 5 Data from lines 9, 10, 13 & 14 9, 11, 13 8 15 42 43 44 45 46 47 48 49 50 51 52 53 54 55 Year Incremental Earnings Forecast ($000s) Sales 2 Cost of Goods Sold 3 Gross Profit 4 Selling, General, and Administrative 5 Research and Development 6 Depreciation 7 EBIT 8 Income Tax at 40% 9 Unlevered Net Income 18 & 19 17 21& 22 23 & 52
Step by Step Solution
There are 3 Steps involved in it

Get step-by-step solutions from verified subject matter experts