

Question: i need help with the average column on data table and starting the chart. please. Tapi tere dar yang kw Using the average data for
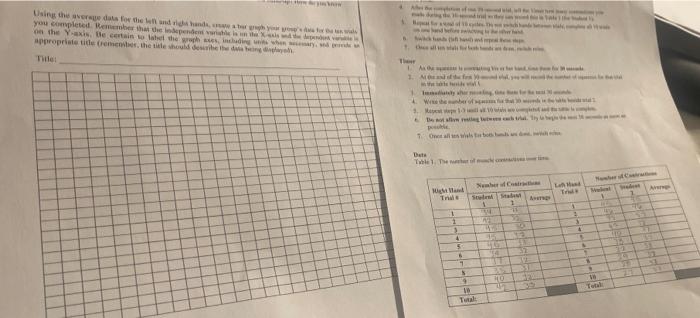
Tapi tere dar yang kw Using the average data for the left and right hands, sweater graph your group's das for the t you completed. Remember that the independent variable is the on the Y-axis. Be certain to label the graph ases, including units when appropriate tide (remember, the title should describe the data being display exis and the depend va y, snd p Title: 4 Ai nak B Wwwch hand ( B 1. the Their Mad of de the devil Inmoduly sher We the anber of s 10 pied De at alle resting tete each trial. Ty posable 1 Over all s wils for both bus 3. Mapent sep 13 Data Table 1. The fol Right Hand Tra 1 4 5 6 1 Number of Contrac Student Stadst Ams S 4 18 Total: 134 A 45 461 14 BAS 40 10 10 35 12 31 320 Triuk 4 . Number of Contracto dest 1 10 Total 13 The P 16 15 21 19 Aveng 19 51 31 SE ST Using the average data for the left and right hands, create a bar graph your group's data for the ten trials you completed. Remember that the independent variable is on the X-axis and the dependent variable is on the Y-axis. Be certain to label the graph axes, including units when necessary, and provide an appropriate title (remember, the title should describe the data being displayed). Title
Step by Step Solution
There are 3 Steps involved in it

Get step-by-step solutions from verified subject matter experts