

Question: ***** I need help with the Average Rate of Return, and Net Present Value and Present Value Index PR 11-6B Capital rationing decision for a
***** I need help with the Average Rate of Return, and Net Present Value and Present Value Index
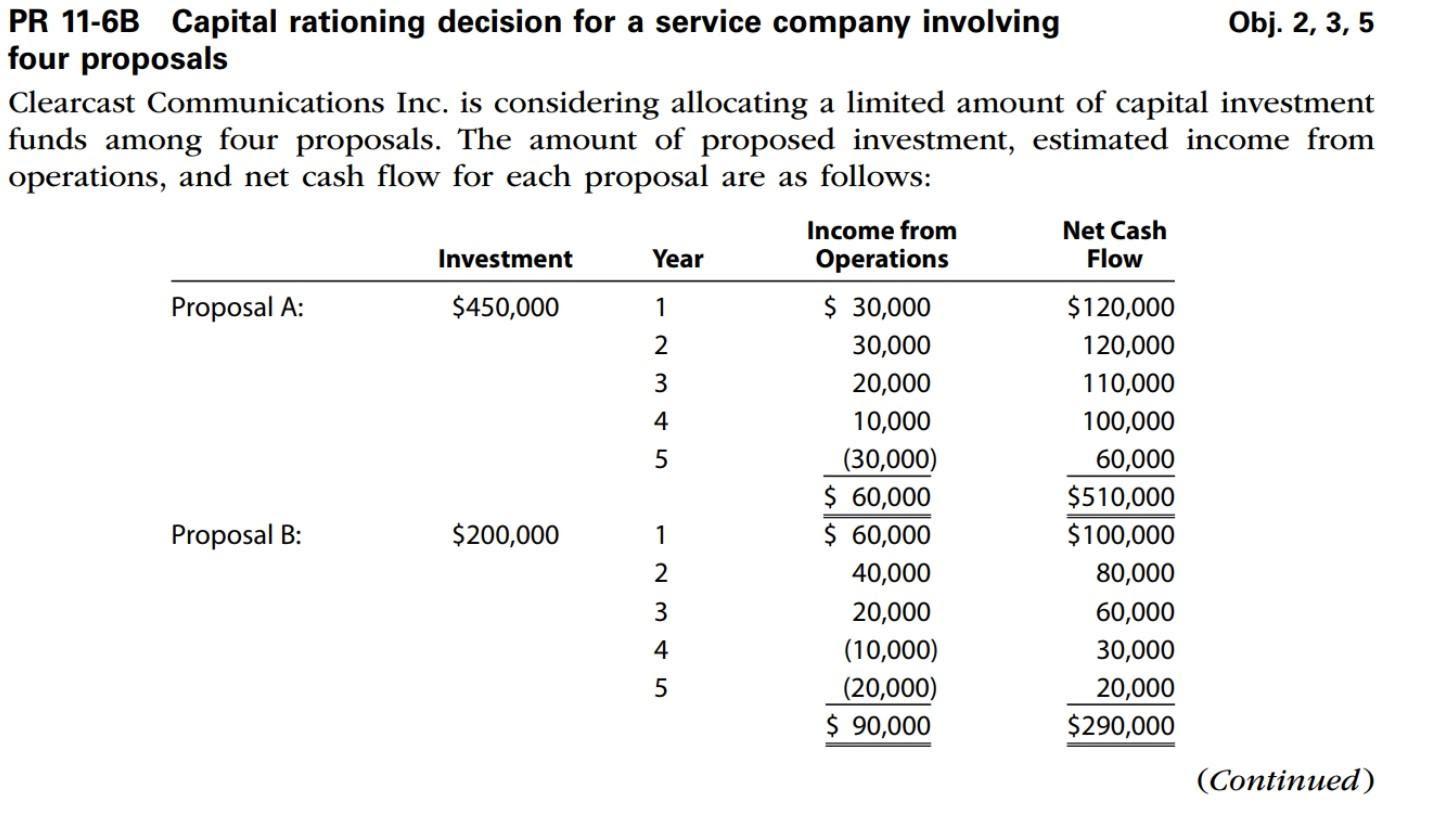
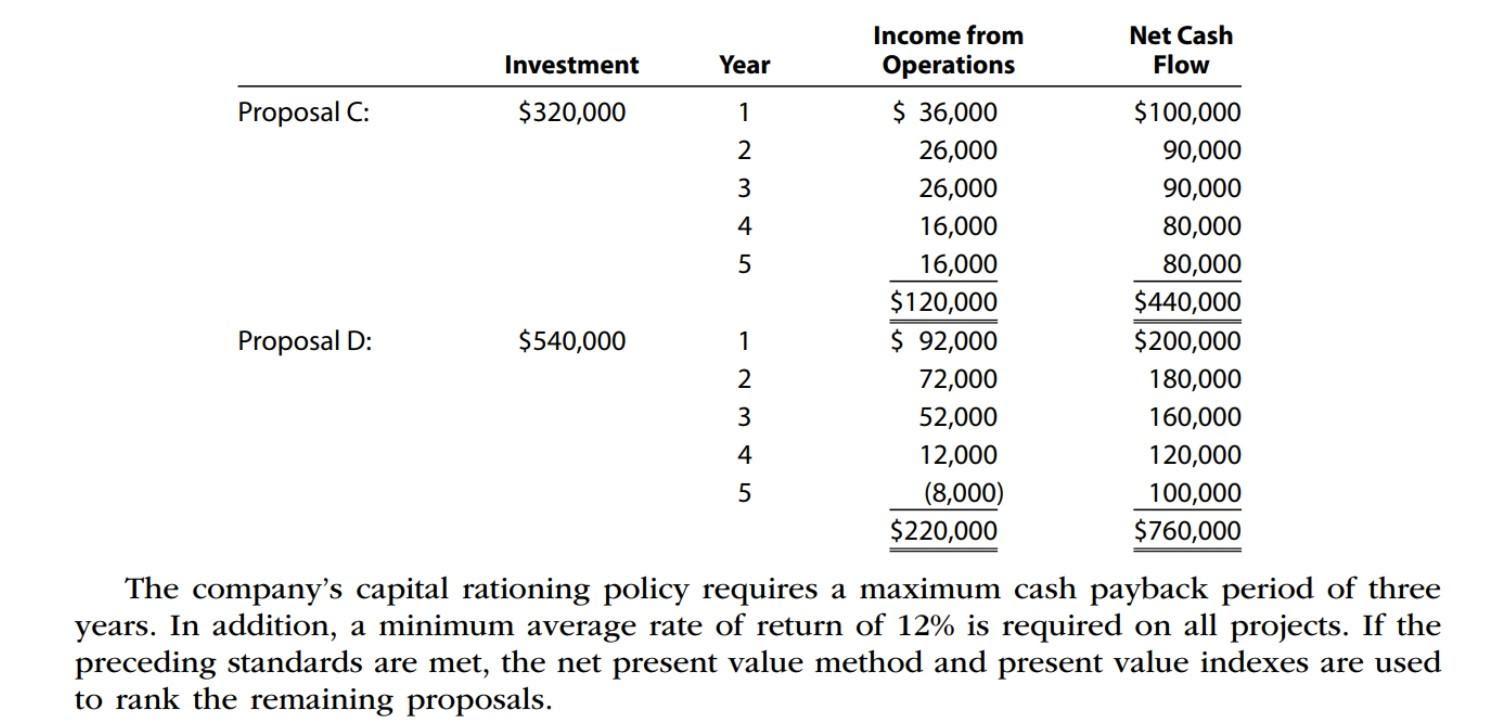
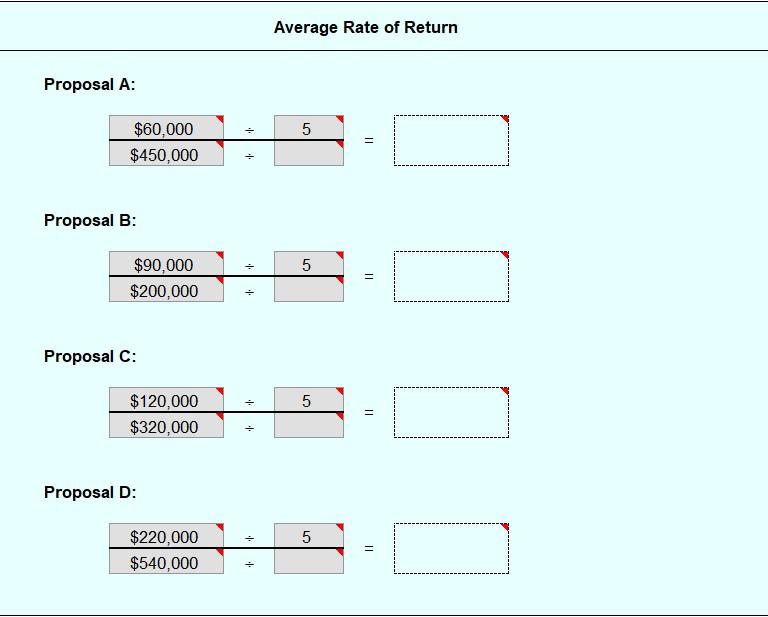
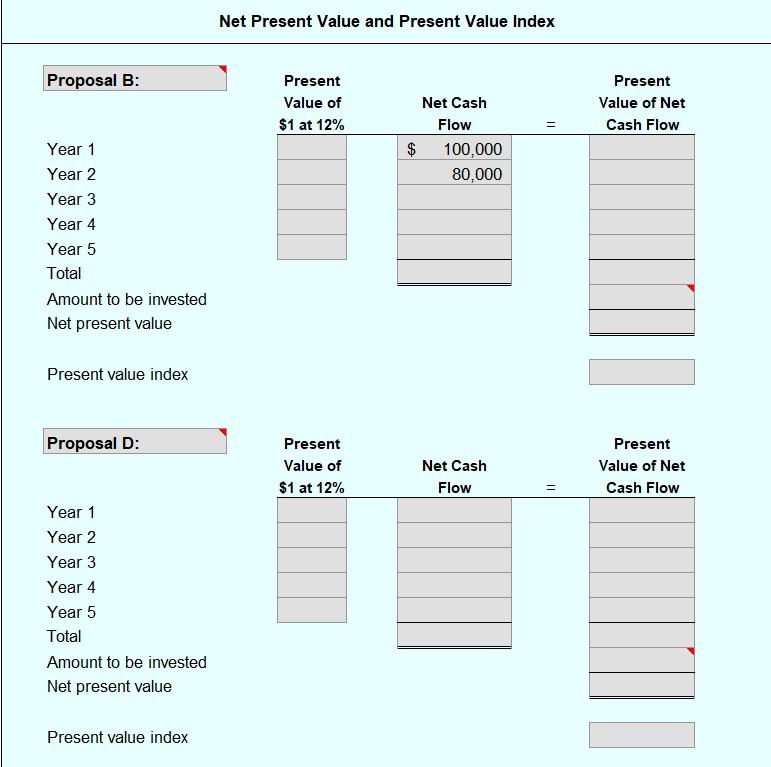
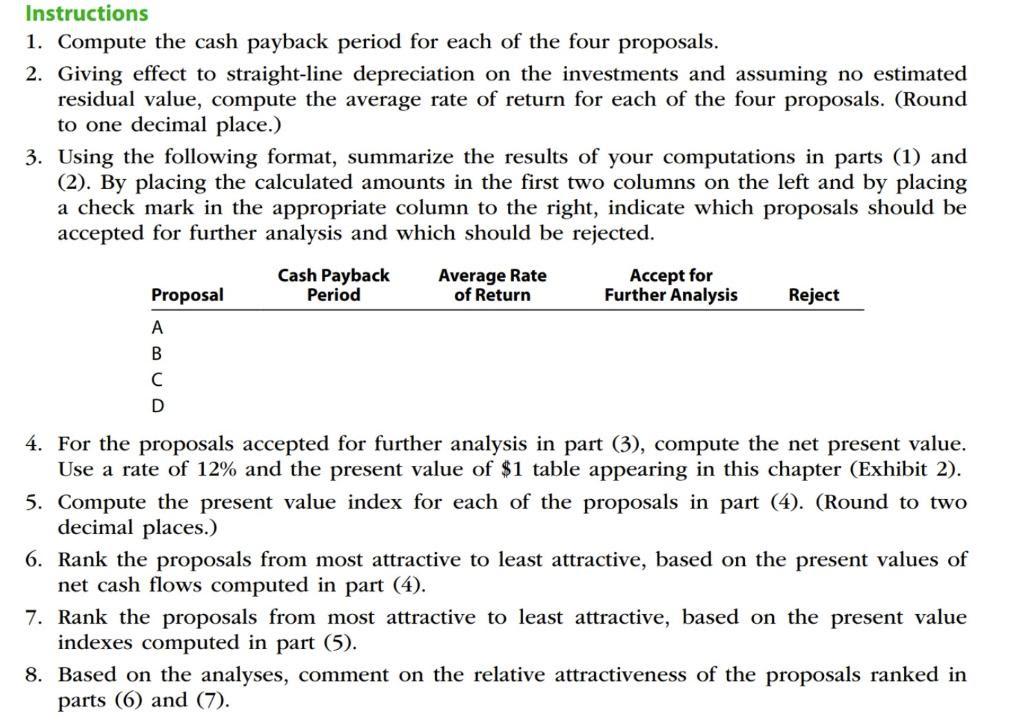
PR 11-6B Capital rationing decision for a service company involving Obj. 2, 3,5 four proposals Clearcast Communications Inc. is considering allocating a limited amount of capital investment funds among four proposals. The amount of proposed investment, estimated income from operations, and net cash flow for each proposal are as follows: Income from Net Cash Investment Year Operations Flow Proposal A: $450,000 1 $ 30,000 $120,000 2 30,000 120,000 3 20,000 110,000 4 10,000 100,000 5 (30,000) 60,000 $ 60,000 $510,000 Proposal B: $200,000 1 $ 60,000 $100,000 2 40,000 80,000 3 20,000 60,000 (10,000) 30,000 5 (20,000) 20,000 $ 90,000 $290,000 (Continued) 4 Net Cash Flow Investment Year Proposal C: $320,000 1 2 3 4 5 Income from Operations $ 36,000 26,000 26,000 16,000 16,000 $120,000 $ 92,000 72,000 52,000 12,000 (8,000) $220,000 $100,000 90,000 90,000 80,000 80,000 $440,000 $200,000 180,000 160,000 120,000 100,000 $760,000 Proposal D: $540,000 1 2 3 4 5 The company's capital rationing policy requires a maximum cash payback period of three years. In addition, a minimum average rate of return of 12% is required on all projects. If the preceding standards are met, the net present value method and present value indexes are used to rank the remaining proposals. Average Rate of Return Proposal A: 5 11 $60,000 $450,000 Proposal B: 5 $90,000 $200,000 11 Proposal C: 5 11 $120,000 $320,000 Proposal D: 5 $220,000 $540,000 = Net Present Value and Present Value Index Proposal B: Present Value of $1 at 12% Present Value of Net Cash Flow Net Cash Flow $ 100,000 80,000 Year 1 Year 2 Year 3 Year 4 Year 5 Total Amount to be invested Net present value Present value index Proposal D: Present Value of $1 at 12% Net Cash Flow Present Value of Net Cash Flow Year 1 Year 2 Year 3 Year 4 Year 5 Total Amount to be invested Net present value Present value index Instructions 1. Compute the cash payback period for each of the four proposals. 2. Giving effect to straight-line depreciation on the investments and assuming no estimated residual value, compute the average rate of return for each of the four proposals. (Round to one decimal place.) 3. Using the following format, summarize the results of your computations in parts (1) and (2). By placing the calculated amounts in the first two columns on the left and by placing a check mark in the appropriate column to the right, indicate which proposals should be accepted for further analysis and which should be rejected. Cash Payback Period Proposal Average Rate of Return Accept for Further Analysis Reject A B D 4. For the proposals accepted for further analysis in part (3), compute the net present value. Use a rate of 12% and the present value of $1 table appearing in this chapter (Exhibit 2). 5. Compute the present value index for each of the proposals in part (4). (Round to two decimal places.) 6. Rank the proposals from most attractive to least attractive, based on the present values of net cash flows computed in part (4). 7. Rank the proposals from most attractive to least attractive, based on the present value indexes computed in part (5). 8. Based on the analyses, comment on the relative attractiveness of the proposals ranked in parts (6) and (7)
Step by Step Solution
There are 3 Steps involved in it

Get step-by-step solutions from verified subject matter experts