

Question: I need help with the bottom question. I finished everything else, but I am not sure with the question at the bottom. Which letter choice
I need help with the bottom question. I finished everything else, but I am not sure with the question at the bottom. Which letter choice please?
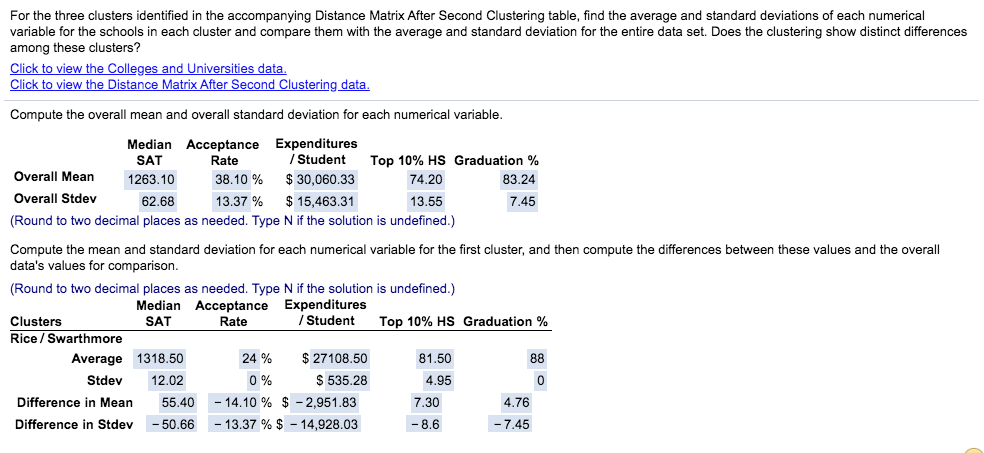
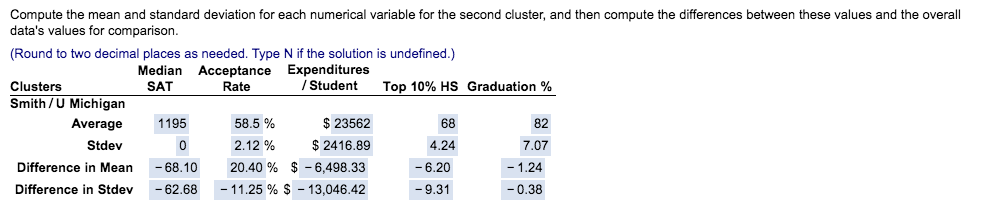
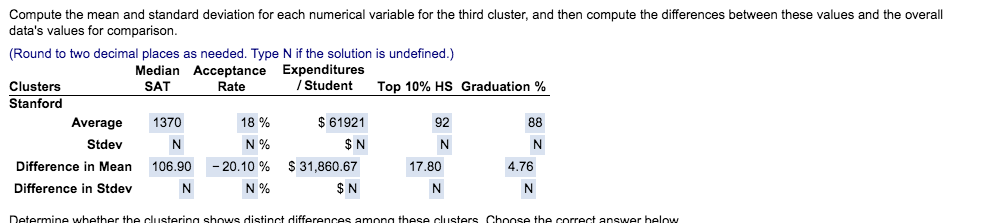
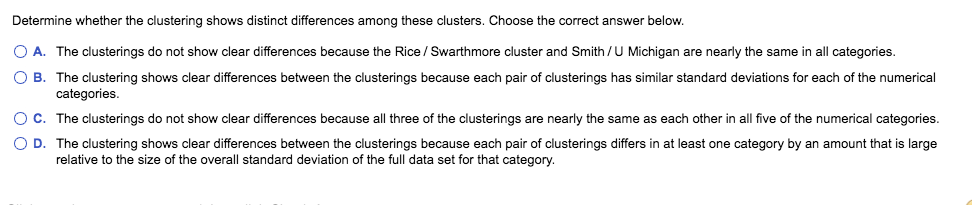
For the three clusters identified in the accompanying Distance Matrix After Second Clustering table, find the average and standard deviations of each numerical variable for the schools in each cluster and compare them with the average and standard deviation for the entire data set. Does the clustering show distinct differences among these clusters? Click to view the Colleges and Universities data. Click to view the Distance Matrix After Second Clustering data. Compute the overall mean and overall standard deviation for each numerical variable. Median Acceptance Expenditures SAT Rate / Student Top 10% HS Graduation % Overall Mean 1263.10 38. 10% $ 30,060.33 74.20 83.24 Overall Stdev 62.68 13.37% $ 15,463.31 13.55 7.45 (Round to two decimal places as needed. Type N if the solution is undefined.) Compute the mean and standard deviation for each numerical variable for the first cluster, and then compute the differences between these values and the overall data's values for comparison. (Round to two decimal places as needed. Type N if the solution is undefined.) Median Acceptance Expenditures Clusters SAT Rate / Student Top 10% HS Graduation % Rice / Swarthmore Average 1318.50 24 % $ 27108.50 81.50 88 Stdev 12.02 0% $ 535.28 4.95 0 Difference in Mean 55.40 - 14.10 % $ - 2,951.83 7.30 4.76 Difference in Stdev -50.66 - 13.37 % $ - 14,928.03 - 8.6 -7.45Compute the mean and standard deviation for each numerical variable for the second cluster, and then compute the differences between these values and the overall data's values for comparison. (Round to two decimal places as needed. Type N if the solution is undefined.) Median Acceptance Expenditures Clusters SAT Rate / Student Top 10% HS Graduation % Smith / U Michigan Average 1195 58.5% $ 23562 68 82 Stdev 0 2.12 % $ 2416.89 4.24 7.07 Difference in Mean -68.10 20.40 % $ -6,498.33 -6.20 - 1.24 Difference in Stdev -62.68 - 11.25 % $ - 13,046.42 -9.31 -0.38Compute the mean and standard deviation for each numerical variable for the third cluster, and then compute the differences between these values and the overall data's values for comparison. (Round to two decimal places as needed. Type N if the solution is undefined.) Median Acceptance Expenditures Clusters SAT Rate / Student Top 10% HS Graduation % Stanford Average 1370 18% $ 61921 92 88 Stdev N N% $ N N N Difference in Mean 106.90 -20.10 % $ 31,860.67 17.80 4.76 Difference in Stdev N N% $ N N NDetermine whether the clustering shows distinct differences among these clusters. Choose the correct answer below. O A. The clusterings do not show clear differences because the Rice / Swarthmore cluster and Smith / U Michigan are nearly the same in all categories. O B. The clustering shows clear differences between the clusterings because each pair of clusterings has similar standard deviations for each of the numerical categories. O C. The clusterings do not show clear differences because all three of the clusterings are nearly the same as each other in all five of the numerical categories. O D. The clustering shows clear differences between the clusterings because each pair of clusterings differs in at least one category by an amount that is large relative to the size of the overall standard deviation of the full data set for that category
Step by Step Solution
There are 3 Steps involved in it

Get step-by-step solutions from verified subject matter experts