

Question: I need help with the code. I attached code here import java.util.Scanner; public class DistributionChart { public static void main (String[] args) { int size
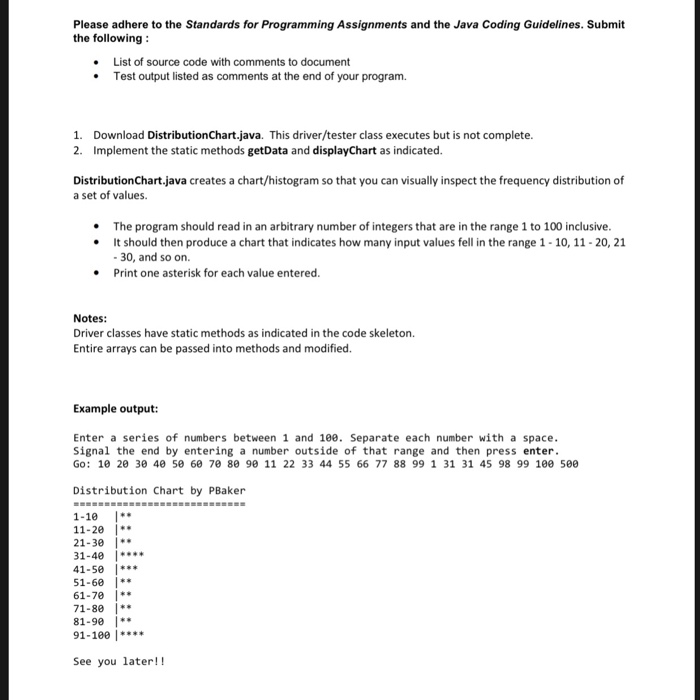
Please adhere to the Standards for Programming Assignments and the Java Coding Guidelines. Submit the following List of source code with comments to document * Test output listed as comments at the end of your program. 1. 2. Download DistributionChart.java. This driver/tester class executes but is not complete. Implement the static methods getData and displayChart as indicated. DistributionChart.java creates a chart/histogram so that you can visually inspect the frequency distribution of a set of values. The program should read in an arbitrary number of integers that are in the range 1 to 100 inclusive It should then produce a chart that indicates how many input values fell in the range 1 10, 11 20, 21 - 30, and so on. Print one asterisk for each value entered Notes: Driver classes have static methods as indicated in the code skeleton. Entire arrays can be passed into methods and modified. Example output: Enter a series of numbers between 1 and 10. Separate each number with a space Signal the end by entering a number outside of that range and then press enter Go: 1 2 3 40 50 60 70 80 9 11 22 33 44 55 66 77 88 99 1 31 31 45 98 99 100 5ee Distribution Chart by PBaker 1-10 11-20 I* 21-30 I* 31-40** 41-50 I** 51-60 ** 61-70 ** 71-80 ** 81-90 * 91-100 |** See you later
Step by Step Solution
There are 3 Steps involved in it

Get step-by-step solutions from verified subject matter experts