Question: I need help with the code in 2.1.1. I ran the code without the first 2 lines (stddev_P and mean_P) and it gave me an
 I need help with the code in 2.1.1. I ran the code without the first 2 lines (stddev_P and mean_P) and it gave me an error saying that stddev_P and mean_P was undefined. So I tried to define them and it isnt't giving me what I need. It printed out this long code with a graph. The graph looks accurate but I don;t know what all the extra code is.
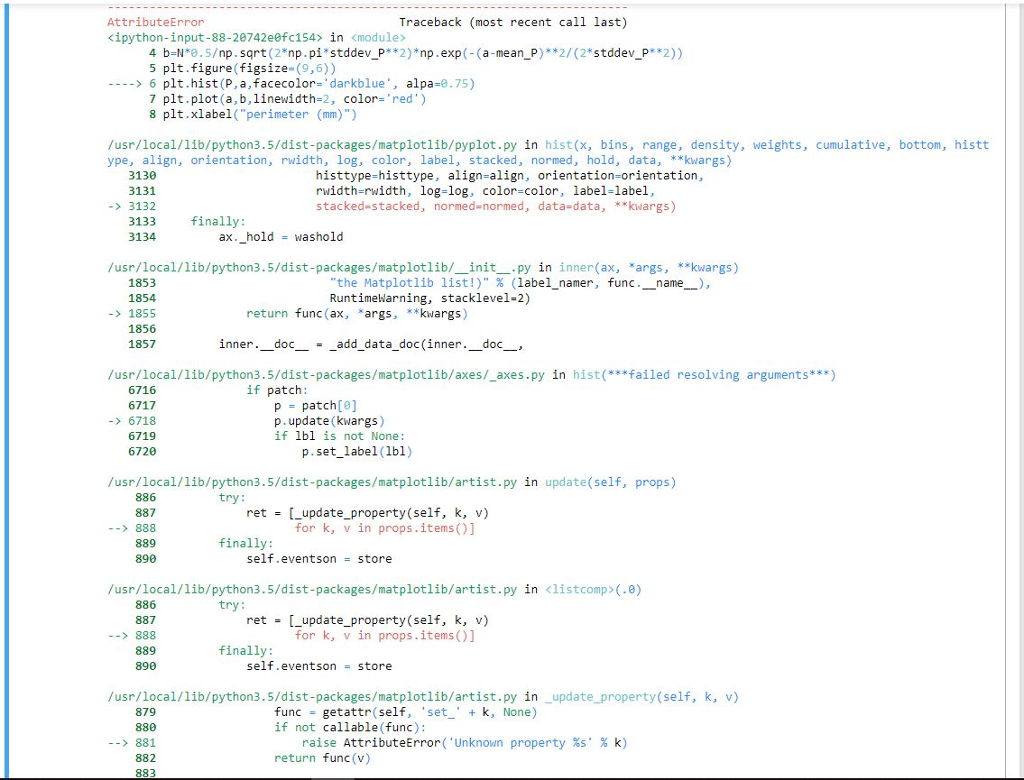
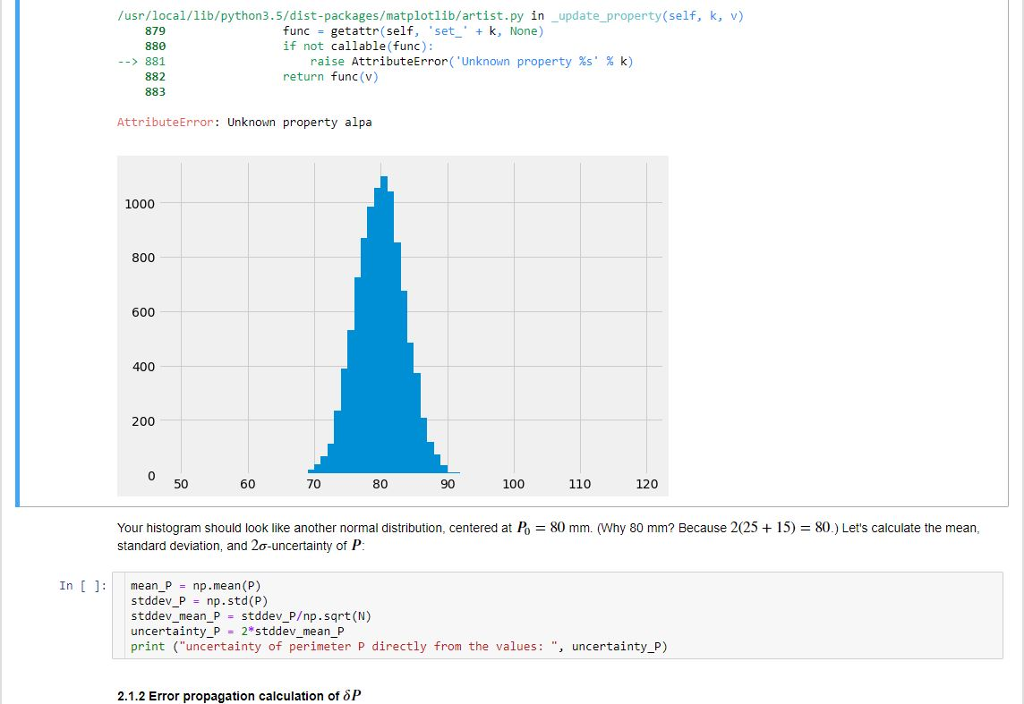
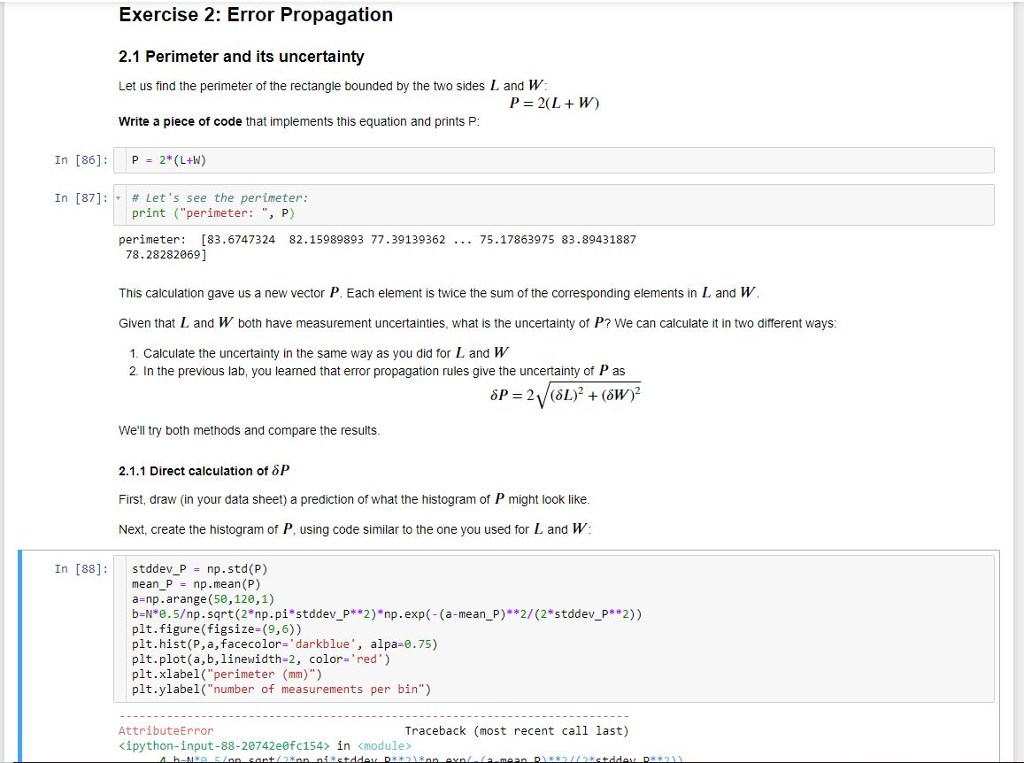
Exercise 2: Error Propagation 2.1 Perimeter and its uncertainty Let us find the perimeter of the rectangle bounded by the two sides L and W Write a piece of code that implements this equation and prints P P = 2( L + W) In [86]: P 2* (L+W) In [87]: |y # Let's see the perimeter: print ("perimeter: ", P perimeter: [83.6747324 82.15989893 77.39139362 75.17863975 83.89431887 78.28282069] This calculation gave us a new vector P. Each element is twice the sum of the corresponding elements in L and W Given that L and W both have measurement uncertainties, what is the uncertainty of P? We can calculate it in two different ways 1. Calculate the uncertainty in the same way as you did for L and W 2 In the previous lab, you leamed that error propagation rules give the uncertainty of P as We'll try both methods and compare the results 2.1.1 Direct calculation of First, draw (in your data sheet) a prediction of what the histogram of P might look like. Next, create the histogram of P, using code similar to the one you used for L and W In [88]: stddev P np.std(P) mean P np.mean (P) a-np.arange (5e,120,1) plt.figure(figsize-(9,6)) pit . hist(P,a,facecolor="darkblue', alpa-0.75) plt.plot(a, b,linewidth-2, color-'red') plt.xlabel("perimeter (mm)") plt.ylabel("number of measurements per bin") AttributeError python-input-88-28742e0fc154) Traceback (most recent call last) n AttributeError python-input-88-28742e0fcisa Traceback (most recent call last) in 4 b-Nrg.5p. sqrt (2*np. pistddev-P**2)"np.exp (-(a-mean, p)**2/(2*stddev-pr *2)) 5 plt.figure(figsize-(9,6)) -6 plt.hist (P,a,facecolor-'darkblue, alpa-0.75) 7 plt.plot(a,b,linewidth-2, color-'red') 8 plt.xlabel( perimeter (mm)") /usr/local/1ib/python3.5/dist-packages/matplotlib/pyplot.py in hist(x, bins, range, density, weights, cumulative, bottom, histt ype, align, orientation, rwidth, log, color, label, stacked, normed, hold, data, **kwargs) 3130 3131 ->3132 3133 3134 histtype-histtype, align-align, orientation-orientation, rwidth-rwidth, log-log, color-color, label-label, stacked-stacked, normed-normed, data-data, **kwargs) finally: ax. holdashold /usr/local/lib/python3.5/dist-packages/matplotlib/_init_-py in inner(ax, *args, **kwargs) 1853 1854 -> 1855 1856 1857 "the Matplotlib list!)" % (label-namer , Runtimelarning, stacklevel-2) func.--name-), return func (ax, args,**kwargs) inner. doc_add data_doc (inner. doc_, /usr/local/lib/python3.5/dist-packages/matplotlib/axes/_axes.py in hist(***failed resolving arguments***) 6716 6717 ->6718 6719 6720 if patch p patch[o] p.update (kwargs) if lbl is not None: p.set label (lbl) /usr/local/lib/python3.5/dist-packages/matplotlib/artist.py in update(self, props) 886 887 --> 888 889 890 try ret-[update_property (self, k, v) for k, v in props.items(0] finally: self.eventson store /usr/local/lib/python3.5/dist-packages/matplotlib/artist.py in (.e) try 886 887 ret [-update-property (self, k, v) = for k, v in props.items(0] finally: 889 890 self.eventson store /usr/local/lib/python3.5/dist-packages/matplotlib/artist.py in update property(self, k, v) 879b func if not getattr(self, 'set-' callable (func): k, None) + 880 raise return func (v) ->881 AttributeError('Unknown property %s' % k) 882 /usr/local/lib/python3.5/dist-packages/matplotlib/artist.py in update property (self, k, v) func getattr(self, 'set_ if not callable (func): k, None) 879 880 --> 881 882 883 raise AttributeError('Unknown property %s' % k) return func (v) AttributeError: Unknown property alpa 1000 800 600 400 200 50 60 70 80 90 100 110 120 Your histogram should look like another normal distribution, centered at P) = 80 mm. Why 80 mm? Because 2(25 + 15) = 80 ) Let's calculate the mean, standard deviation, and 2o-uncertainty of P. In [mean P np.mean(P) stddev_P np.std(P) stddev mean P = stddev Pp "sqrt (N) uncertainty P 2 stddev mean_P print ("uncertainty of perimeter P directly from the values: uncertainty_P) 2.1.2 Error propagation calculation of oF


