

Question: I need help with the excel calculations and graph. Following are the results of a sieve analysis: Plot the particle - size distribution curve Determine
I need help with the excel calculations and graph.
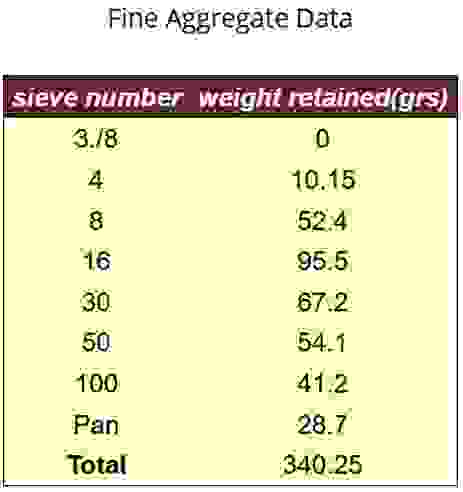
Following are the results of a sieve analysis:
Plot the particlesize distribution curve
Determine the fineness modulus
Fine Aggregate Data
Step by Step Solution
There are 3 Steps involved in it
1 Expert Approved Answer
Step: 1 Unlock

Question Has Been Solved by an Expert!
Get step-by-step solutions from verified subject matter experts
Step: 2 Unlock
Step: 3 Unlock