

Question: I need help with the following problem: Aggregate demand, aggregate supply, and the Phillips curve In the year 2027, aggregate demand and aggregate supply in
I need help with the following problem:
Aggregate demand, aggregate supply, and the Phillips curve
In the year 2027, aggregate demand and aggregate supply in the imaginary country of Daisen-Oki are represented by the curves AD2027and AS on the following graph. The price level is currently 102. The graph also shows two potential outcomes for 2028. The first possible aggregate demand curve is given by the curve labeled ADAcurve, resulting in the outcome given by point A. The second possible aggregate demand curve is given by the curve labeled ADB, resulting in the outcome given by point B.
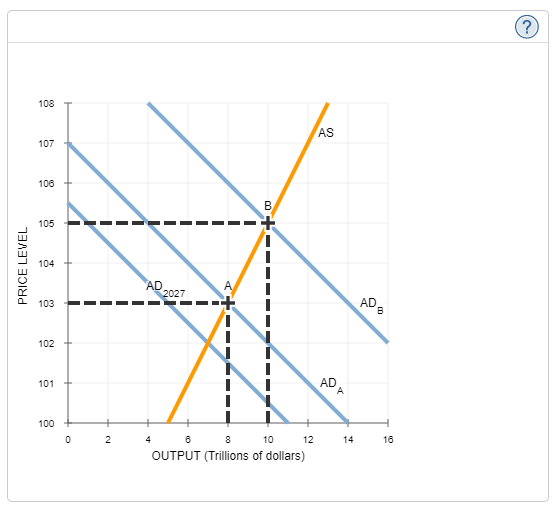
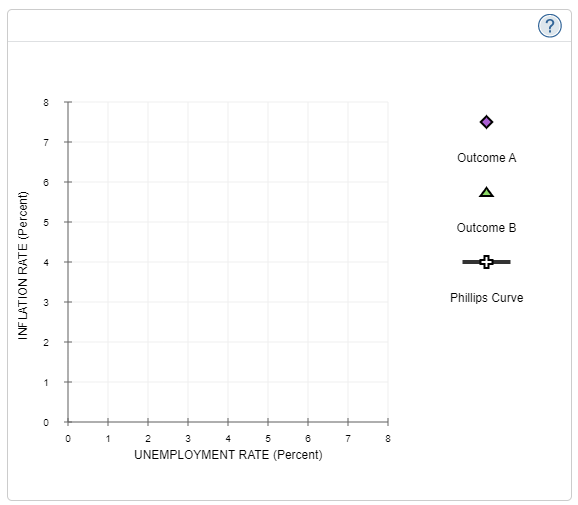
108 AS 107 106 B 105 104 PRICE LEVEL AD A 2027 ADE 103 102 ADA 101 100 8 12 14 2 4 10 OUTPUT (Trillions of dollars)CO O Outcome A A Outcome B 4 INFLATION RATE (Percent) Phillips Curve 2 0 1 2 3 4 5 6 7 UNEMPLOYMENT RATE (Percent)
Step by Step Solution
There are 3 Steps involved in it

Get step-by-step solutions from verified subject matter experts