

Question: I need help with the graph. 13. Changes to the security market line The following graph plots the current security market line (SML) and indicates
I need help with the graph.
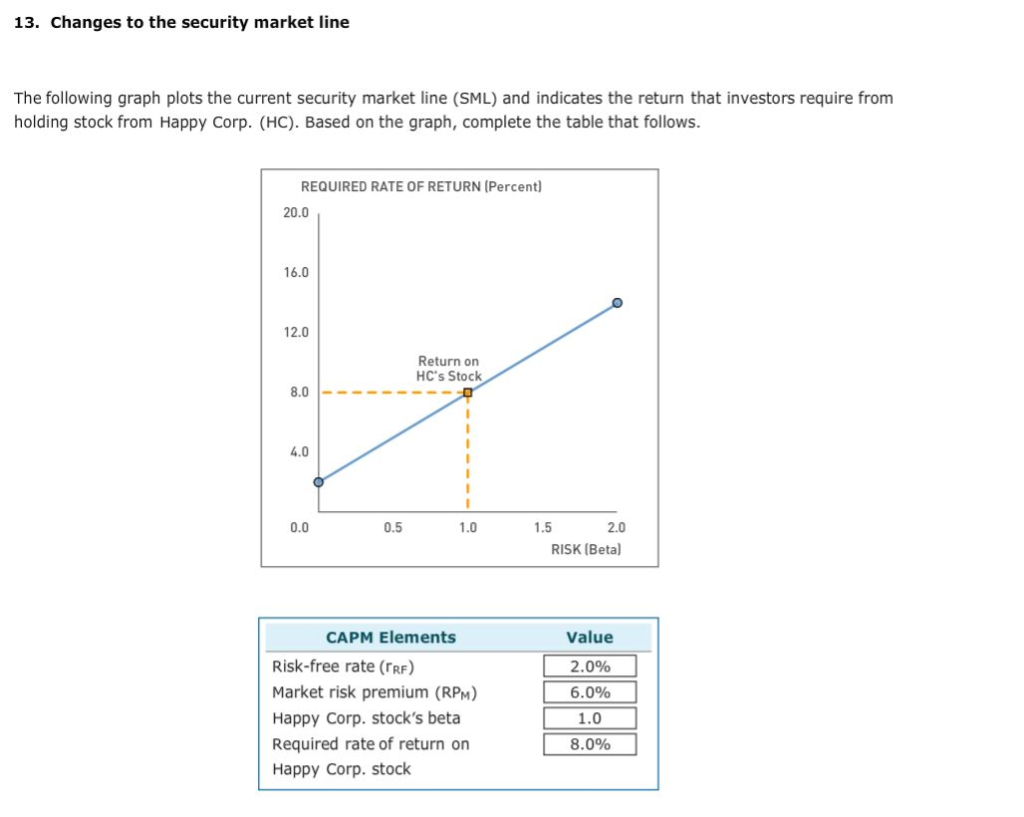
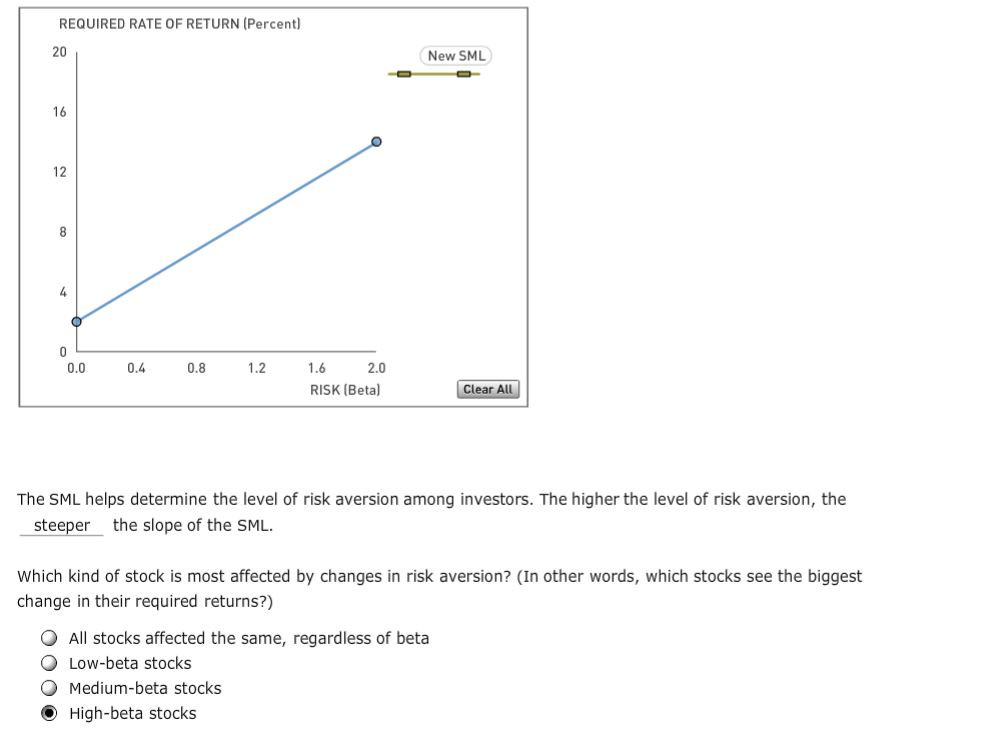
13. Changes to the security market line The following graph plots the current security market line (SML) and indicates the return that investors require from holding stock from Happy Corp. (HC). Based on the graph, complete the table that follows. REQUIRED RATE OF RETURN (Percent 20.0 16.0 12.0 Return on HC's Stock 8.0 4.0 0.0 0.5 1.0 1.5 2.0 RISK (Beta) Value 2.0% 6.0% 1.0 CAPM Elements Risk-free rate (rRF) Market risk premium (RPM) Happy Corp. stock's beta quired rate of return on8.0% Happy Corp. stock REQUIRED RATE OF RETURN (Percent) 20 New SML 16 12 0.0 0.4 0.8 12 6 2.0 RISK (Betal Clear All The SML helps determine the level of risk aversion among investors. The higher the level of risk aversion, the steeper the slope of the SML Which kind of stock is most affected by changes in risk aversion? (In other words, which stocks see the biggest change in their required returns?) O All stocks affected the same, regardless of beta Low-beta stocks O Medium-beta stocks High-beta stocks
Step by Step Solution
There are 3 Steps involved in it

Get step-by-step solutions from verified subject matter experts