

Question: i need help with the ones that i got wrong accounts receivable at May 31 2011 : $3,138 inventories at may 31 2011: $2,715 total
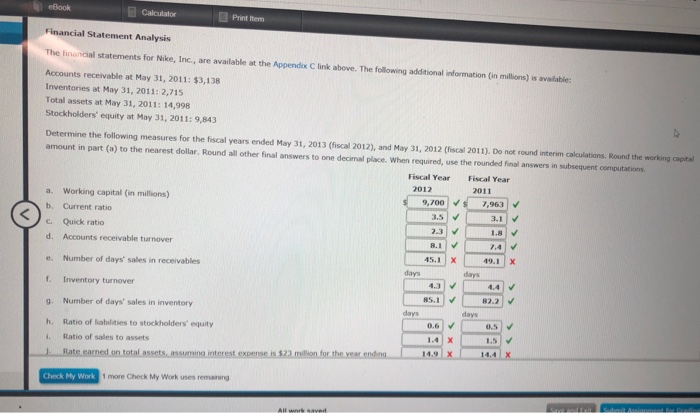
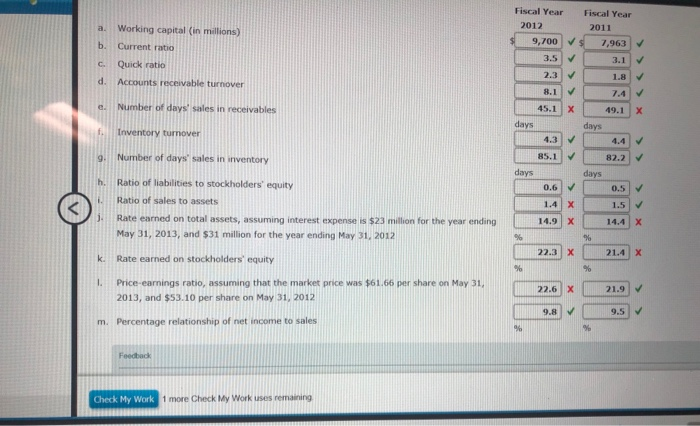
Calculator eBlook Financial Statement Analysis The financial statements for Nike, Inc., are available at the Appendix C link abeve. The following additional information (in millions) is available: Print Item Accounts receivable at May 31, 2011: $3,138 Inventories at May 31, 2011: 2,715 Total assets at May 31, 2011: 14,998 Stockholders' equity at May 31, 2011: 9,843 Determine the following measures for the fiscal years ended May 31, 2013 (fiscal 2012), and May 31, 2012 (fiscal 2011). Do not round interim calculations. Round the working capital amount in part (a) to the nearest dollar. Round all other final answers to one decimal place. When required, use the rounded final answers in subsequent computations Fiscal Year Fiscal Year 2011 2012 a. Working capital (in millions) b. Current ratio c. Quick ratio d. Accounts receivable turnover e. Number of days' sales in receivables f. Inventory turnover 9,700 $ 7,963 3.1 3.5 2.3 V 45.1 x49.1X 4 V 85.1 82. 9. Number of days' sales in inventory h. Ratio of hablities to stockholders' equity . Ratio of sales to assets days days 0.6 14 X 1.5 1 more Check My Work uses remaining Check My Work i Fiscal Year Fiscal Year a. Working capital (in millions b. Current ratio c. Quick ratio d. Accounts receivable turnover 2012 2011 9,7007,963 3.1 1.8 V .4 V 2.3 8.1 V Number of days sales in receivables f. Inventory turnover 9. Number of days sales in inventory h. Ratio of liabilities to stockholders equity 43.1 X 49.1 X days days 43 V 85.1 V 4.4 82.2 days days 0.6V 1.4 X 14.9 X 0.5 V Ratio of sales to assets j. Rate earned on total assets, assuming interest expense is $23 million for the year ending 1.5 14.4 X May 31, 2013, and $31 million for the year ending May 31, 2012 223 x 21.4 x k. Rate earned on stockholders equity I. Price-earnings ratio, assuming that the market price was $61.66 per share on May 31 1.9 9.5 22.6X 9.8 V 2013, and $53.10 per share on May 31, 2012 Percentage relationship of net income to sales m. Check My Work 1 more Check My Work uses remaining Calculator eBlook Financial Statement Analysis The financial statements for Nike, Inc., are available at the Appendix C link abeve. The following additional information (in millions) is available: Print Item Accounts receivable at May 31, 2011: $3,138 Inventories at May 31, 2011: 2,715 Total assets at May 31, 2011: 14,998 Stockholders' equity at May 31, 2011: 9,843 Determine the following measures for the fiscal years ended May 31, 2013 (fiscal 2012), and May 31, 2012 (fiscal 2011). Do not round interim calculations. Round the working capital amount in part (a) to the nearest dollar. Round all other final answers to one decimal place. When required, use the rounded final answers in subsequent computations Fiscal Year Fiscal Year 2011 2012 a. Working capital (in millions) b. Current ratio c. Quick ratio d. Accounts receivable turnover e. Number of days' sales in receivables f. Inventory turnover 9,700 $ 7,963 3.1 3.5 2.3 V 45.1 x49.1X 4 V 85.1 82. 9. Number of days' sales in inventory h. Ratio of hablities to stockholders' equity . Ratio of sales to assets days days 0.6 14 X 1.5 1 more Check My Work uses remaining Check My Work i Fiscal Year Fiscal Year a. Working capital (in millions b. Current ratio c. Quick ratio d. Accounts receivable turnover 2012 2011 9,7007,963 3.1 1.8 V .4 V 2.3 8.1 V Number of days sales in receivables f. Inventory turnover 9. Number of days sales in inventory h. Ratio of liabilities to stockholders equity 43.1 X 49.1 X days days 43 V 85.1 V 4.4 82.2 days days 0.6V 1.4 X 14.9 X 0.5 V Ratio of sales to assets j. Rate earned on total assets, assuming interest expense is $23 million for the year ending 1.5 14.4 X May 31, 2013, and $31 million for the year ending May 31, 2012 223 x 21.4 x k. Rate earned on stockholders equity I. Price-earnings ratio, assuming that the market price was $61.66 per share on May 31 1.9 9.5 22.6X 9.8 V 2013, and $53.10 per share on May 31, 2012 Percentage relationship of net income to sales m. Check My Work 1 more Check My Work uses remaining
Step by Step Solution
There are 3 Steps involved in it

Get step-by-step solutions from verified subject matter experts