

Question: I need help with the question labeled D. How do I use the data to make a scatter graph? Thank you to anyone willing to
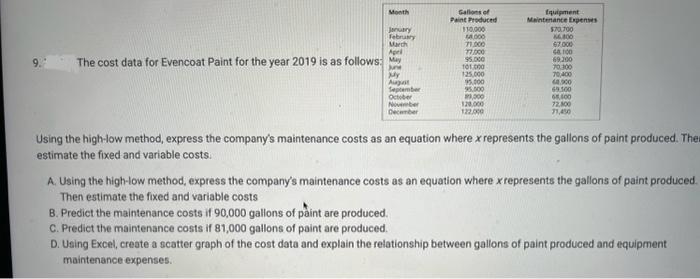
9. The cost data for Evencoat Paint for the year 2019 is as follows Using the high-low method, express the company's maintenance costs as an equation where x represents the gallons of paint produced. Th estimate the fixed and variable costs. A. Using the high-low method, express the company's maintenance costs as an equation where x represents the gallons of paint producec Then estimate the fixed and variable costs B. Predict the maintenance costs if 90,000 gallons of paint are produced. C. Predict the maintenance costs if 81,000 gallons of paint are produced. D. Using Excel, create a scatter graph of the cost data and explain the relationship between gallons of paint produced and equipment maintenance expenses
Step by Step Solution
There are 3 Steps involved in it

Get step-by-step solutions from verified subject matter experts