Question: I need help with the recommendation tab Recommendation Narrative:client oriented Provide overall recommendation as an advisor to clients regarding this firms. If you were a
I need help with the recommendation tab
Recommendation Narrative:client oriented
Provide overall recommendation as an advisor to clients regarding this firms.
If you were a financial advisor, what recommendation would you give your clients regarding their current holdings in Amtek and future investment decisions?
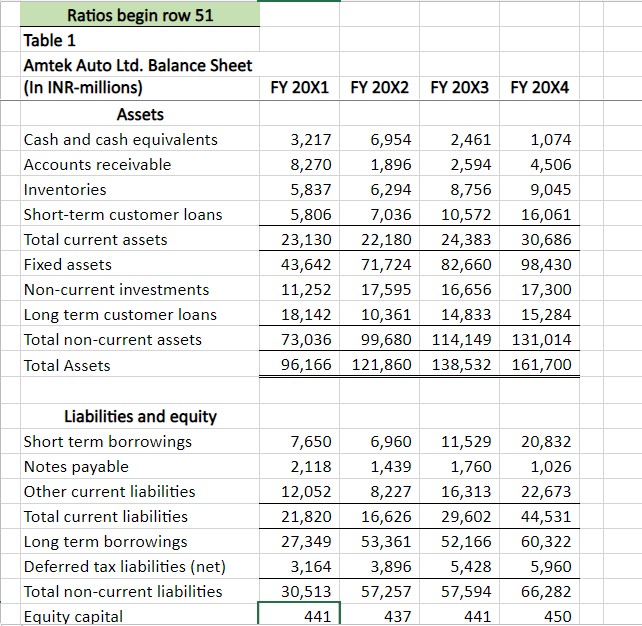
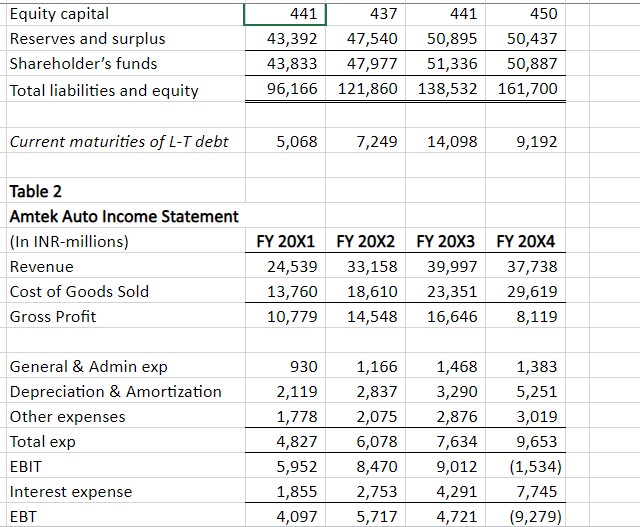
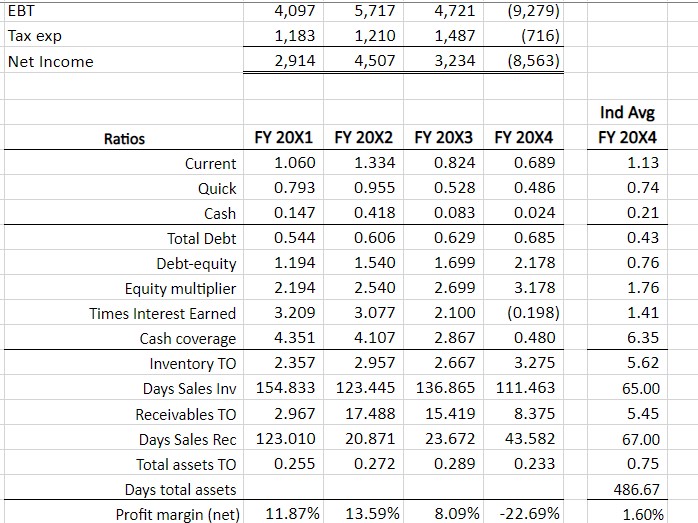
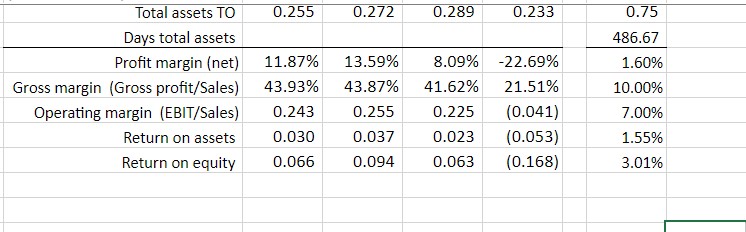
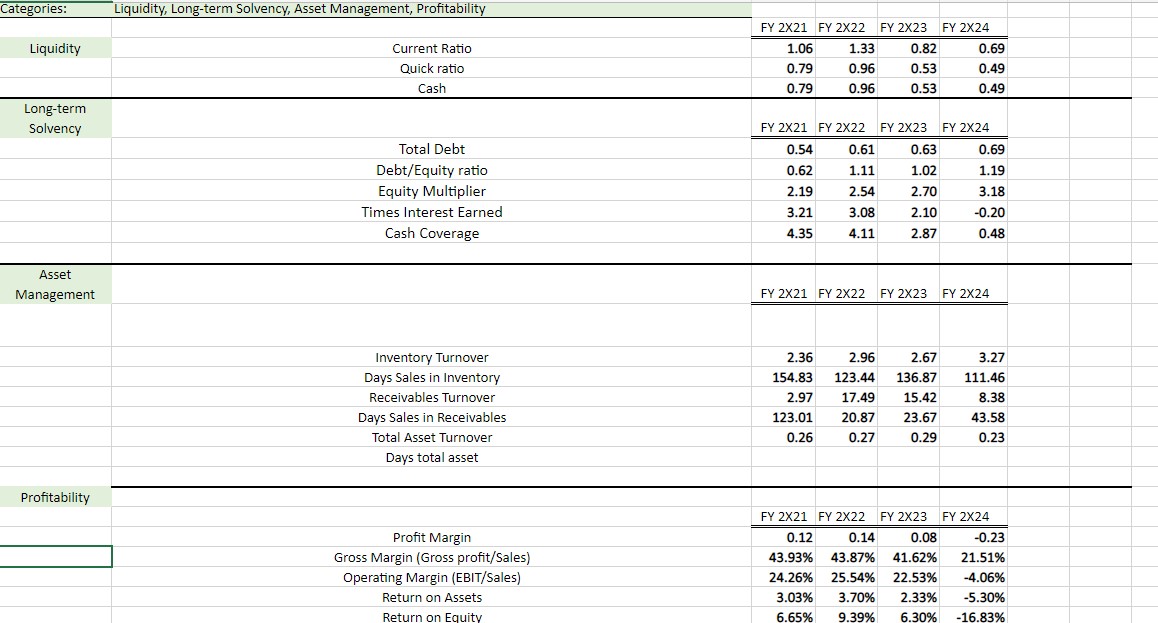
Ratios begin row 51 Table 1 Amtek Auto Ltd. Balance Sheet (In INR-millions) FY 20X1 FY 20X2 FY 20X3 FY 20X4 Assets Cash and cash equivalents 3,217 6,954 2,461 1,074 Accounts receivable 8,270 1,896 2,594 4,506 Inventories 5,837 6,294 8,756 9,045 Short-term customer loans 5,806 7,036 10,572 16,061 Total current assets 23,130 22,180 24,383 30,686 Fixed assets 43,642 71,724 82,660 98,430 Non-current investments 11,252 17,595 16,656 17,300 Long term customer loans 18,142 10,361 14,833 15,284 Total non-current assets 73,036 99,680 114,149 131,014 Total Assets 96,166 121,860 138,532 161,700 Liabilities and equity Short term borrowings 7,650 6,960 11,529 20,832 Notes payable 2,118 1,439 1,760 1,026 Other current liabilities 12,052 8,227 16,313 22,673 Total current liabilities 21,820 16,626 29,602 44,531 Long term borrowings 27,349 53,361 52,166 60,322 Deferred tax liabilities (net) 3,164 3,896 5,428 5,960 Total non-current liabilities 30,513 57,257 57,594 66,282 Equity capital 441 437 441 450Equity capital 441 437 441 450 Reserves and surplus 43,392 47,540 50,895 50,437 Shareholder's funds 43,833 47,977 51,336 50,887 Total liabilities and equity 96,166 121,860 138,532 161,700 Current maturities of L-T debt 5,068 7,249 14,098 9,192 Table 2 Amtek Auto Income Statement (In INR-millions) FY 20X1 FY 20X2 FY 20X3 FY 20X4 Revenue 24,539 33,158 39,997 37,738 Cost of Goods Sold 13,760 18,610 23,351 29,619 Gross Profit 10,779 14,548 16,646 8,119 General & Admin exp 930 1,166 1,468 1,383 Depreciation & Amortization 2,119 2,837 3,290 5,251 Other expenses 1,778 2,075 2,876 3,019 Total exp 4,827 6,078 7,634 9,653 EBIT 5,952 8,470 9,012 (1,534) Interest expense 1,855 2,753 4,291 7,745 EBT 4,097 5,717 4,721 (9,279)EBT 4,097 5,717 4,721 (9,279) Tax exp 1,183 1,210 1,487 (716) Net Income 2,914 4,507 3,234 (8,563) Ind Avg Ratios FY 20X1 FY 20X2 FY 20X3 FY 20X4 FY 20X4 Current 1.060 1.334 0.824 0.689 1.13 Quick 0.793 0.955 0.528 0.486 0.74 Cash 0.147 0.418 0.083 0.024 0.21 Total Debt 0.544 0.606 0.629 0.685 0.43 Debt-equity 1.194 1.540 1.699 2.178 0.76 Equity multiplier 2.194 2.540 2.699 3.178 1.76 Times Interest Earned 3.209 3.077 2.100 (0.198) 1.41 Cash coverage 4.351 4.107 2.867 0.480 6.35 Inventory TO 2.357 2.957 2.667 3.275 5.62 Days Sales Inv 154.833 123.445 136.865 111.463 65.00 Receivables TO 2.967 17.488 15.419 8.375 5.45 Days Sales Rec 123.010 20.871 23.672 43.582 67.00 Total assets TO 0.255 0.272 0.289 0.233 0.75 Days total assets 486.67 Profit margin (net) 11.87% 13.59% 8.09% -22.69% 1.60%Total assets TO 0.255 0.272 0.289 0.233 0.75 Days total assets 486.67 Profit margin (net) 11.87% 13.59% 8.09% -22.69% 1.60% Gross margin (Gross profit/Sales) 43.93% 43.87% 41.62% 21.51% 10.00% Operating margin (EBIT/Sales) 0.243 0.255 0.225 (0.041) 7.00% Return on assets 0.030 0.037 0.023 (0.053) 1.55% Return on equity 0.066 0.094 0.063 (0.168) 3.01%Categories: Liquidity, Long-term Solvency, Asset Management, Profitability FY 2X21 FY 2X22 FY 2X23 FY 2X24 Liquidity Current Ratio 1.06 1.33 0.82 0.69 Quick ratio 0.79 0.96 0.53 0.49 Cash 0.79 0.96 0.53 0.49 Long-term Solvency FY 2X21 FY 2X22 FY 2X23 FY 2X24 Total Debt 0.54 0.61 0.63 0.69 Debt/Equity ratio 0.62 1.11 1.02 1.19 Equity Multiplier 2.19 2.54 2.70 3.18 Times Interest Earned 3.21 3.08 2.10 -0.20 Cash Coverage 4.35 4.11 2.87 0.48 Asset Management FY 2X21 FY 2X22 FY 2X23 FY 2X24 Inventory Turnover 2.36 2.96 2.67 3.27 Days Sales in Inventory 154.83 123.44 136.87 111.46 Receivables Turnover 2.97 17.49 15.42 8.38 Days Sales in Receivables 123.01 20.87 23.67 43.58 Total Asset Turnover 0.26 0.27 0.29 0.23 Days total asset Profitability FY 2X21 FY 2X22 FY 2X23 FY 2X24 Profit Margin 0.12 0.14 0.08 -0.23 Gross Margin (Gross profit/Sales) 43.93% 43.87% 41.62% 21.51% Operating Margin (EBIT/Sales) 24.26% 25.54% 22.53% -4.06% Return on Assets 3.03% 3.70% 2.33% -5.30% Return on Equity 6.65% 9.39% 6.30% -16.83%
Step by Step Solution
There are 3 Steps involved in it
1 Expert Approved Answer
Step: 1 Unlock
Question Has Been Solved by an Expert!
Get step-by-step solutions from verified subject matter experts
Step: 2 Unlock
Step: 3 Unlock
Students Have Also Explored These Related Finance Questions!