Question: I need help with these four questions based on the case. 4) Althol Furniture Case, p. 208. Answer the questions below instead of the questions
I need help with these four questions based on the case. 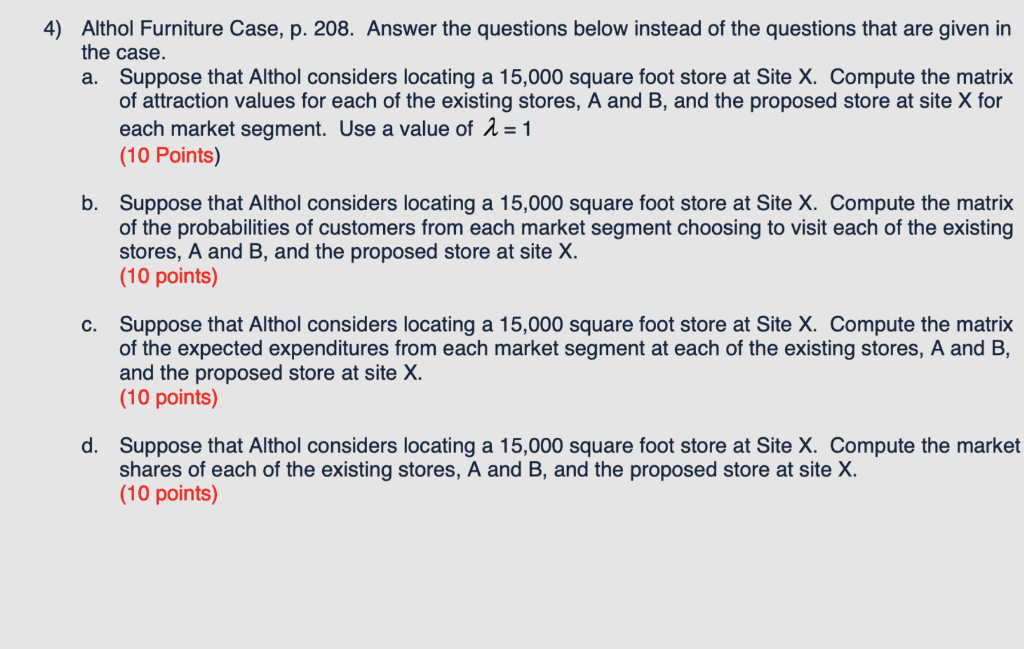
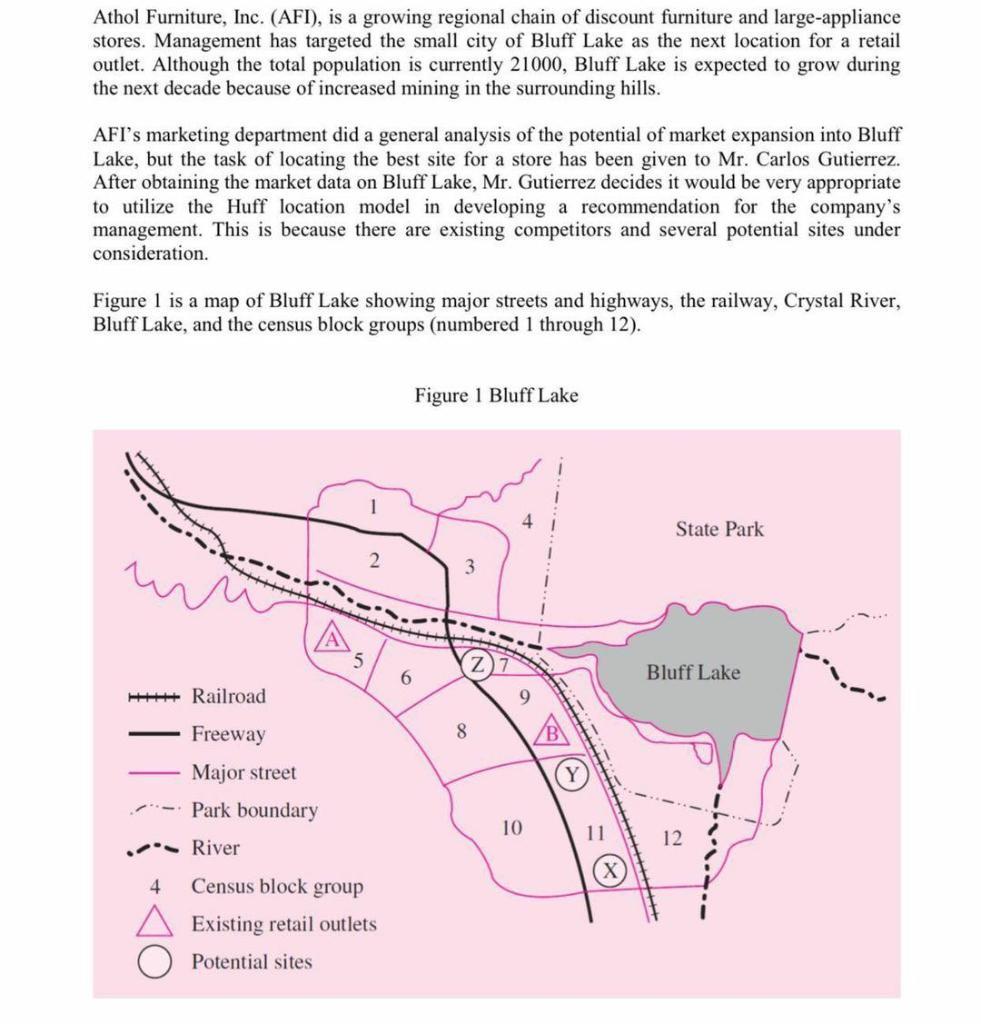
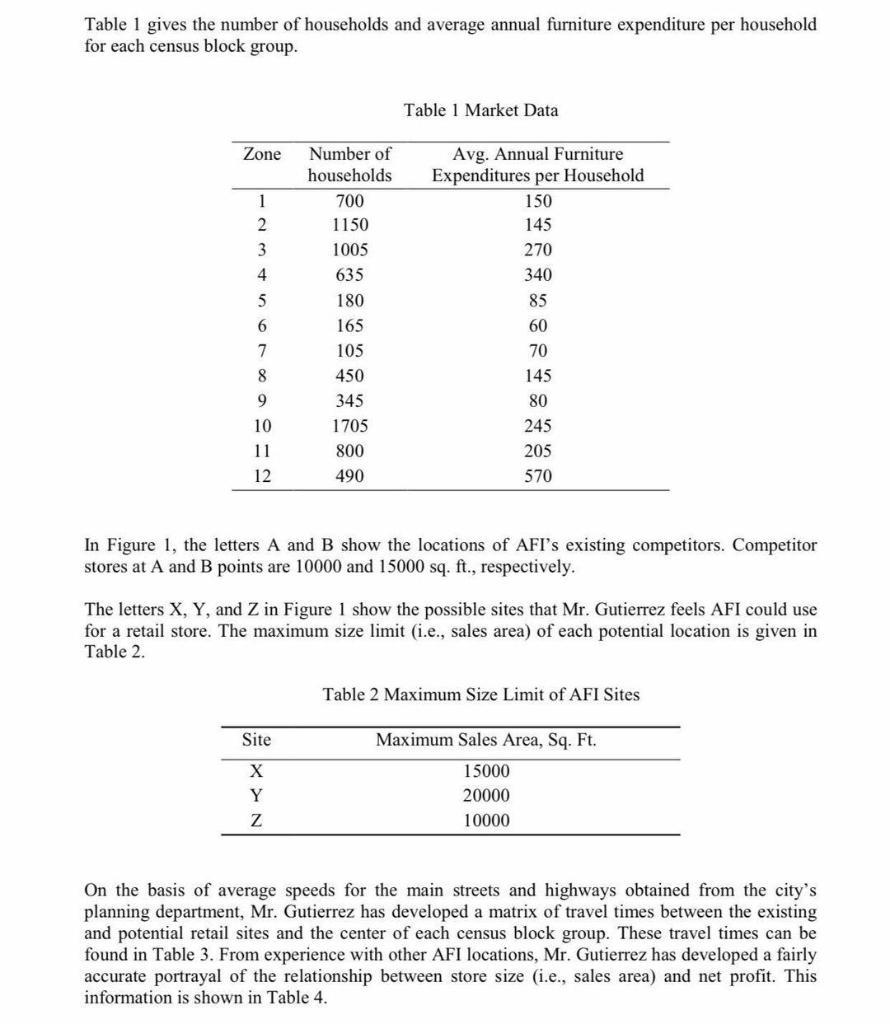
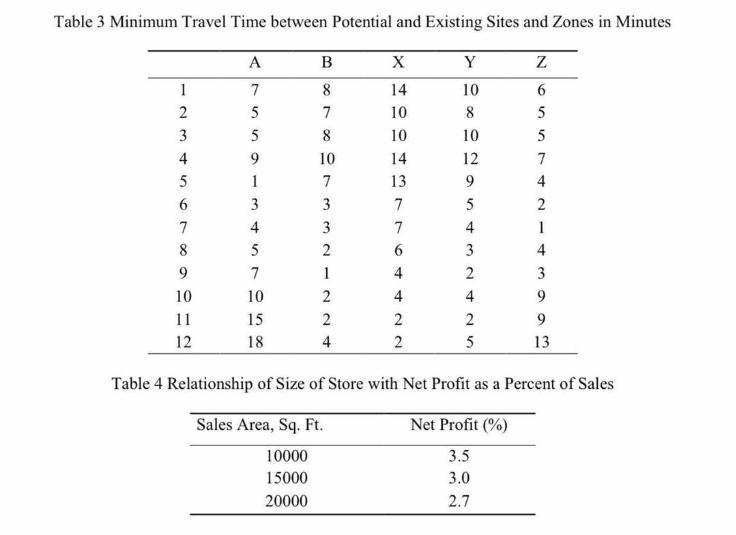
4) Althol Furniture Case, p. 208. Answer the questions below instead of the questions that are given in the case. a. Suppose that Althol considers locating a 15,000 square foot store at Site X. Compute the matrix of attraction values for each of the existing stores, A and B, and the proposed store at site X for each market segment. Use a value of a = 1 (10 Points) b. Suppose that Althol considers locating a 15,000 square foot store at Site X. Compute the matrix of the probabilities of customers from each market segment choosing to visit each of the existing stores, A and B, and the proposed store at site X. (10 points) c. Suppose that Althol considers locating a 15,000 square foot store at Site X. Compute the matrix of the expected expenditures from each market segment at each of the existing stores, A and B, and the proposed store at site X. (10 points) d. Suppose that Althol considers locating a 15,000 square foot store at Site X. Compute the market shares of each of the existing stores, A and B, and the proposed store at site X. (10 points) Athol Furniture, Inc. (AFI), is a growing regional chain of discount furniture and large-appliance stores. Management has targeted the small city of Bluff Lake as the next location for a retail outlet. Although the total population is currently 21000, Bluff Lake is expected to grow during the next decade because of increased mining in the surrounding hills. AFI's marketing department did a general analysis of the potential of market expansion into Bluff Lake, but the task of locating the best site for a store has been given to Mr. Carlos Gutierrez. After obtaining the market data on Bluff Lake, Mr. Gutierrez decides it would be very appropriate to utilize the Huff location model in developing a recommendation for the company's management. This is because there are existing competitors and several potential sites under consideration. Figure 1 is a map of Bluff Lake showing major streets and highways, the railway, Crystal River, Bluff Lake, and the census block groups (numbered 1 through 12). Figure 1 Bluff Lake State Park ur 3 27 6 Bluff Lake +++++ Railroad 8 Freeway Major street - Park boundary 10 12 River 4 Census block group A Existing retail outlets Potential sites Table 1 gives the number of households and average annual furniture expenditure per household for each census block group. Table 1 Market Data Zone 1 2 3 4 Avg. Annual Furniture Expenditures per Household 150 145 270 340 Number of households 700 1150 1005 635 180 165 105 450 345 1705 800 85 5 6 7 8 60 9 10 70 145 80 245 205 11 12 490 570 In Figure 1, the letters A and B show the locations of AFI's existing competitors. Competitor stores at A and B points are 10000 and 15000 sq. ft., respectively. The letters X, Y, and Z in Figure 1 show the possible sites that Mr. Gutierrez feels AFI could use for a retail store. The maximum size limit (i.e., sales area) of each potential location is given in Table 2. Table 2 Maximum Size Limit of AFI Sites Site X Y Z Maximum Sales Area, Sq. Ft. 15000 20000 10000 On the basis of average speeds for the main streets and highways obtained from the city's planning department, Mr. Gutierrez has developed a matrix of travel times between the existing and potential retail sites and the center of each census block group. These travel times can be found in Table 3. From experience with other AFI locations, Mr. Gutierrez has developed a fairly accurate portrayal of the relationship between store size (i.e., sales area) and net profit. This information is shown in Table 4. Table 3 Minimum Travel Time between Potential and Existing Sites and Zones in Minutes Y A 7 5 5 9 1 3 4 5 7 10 15 1 2 3 4 5 6 7 8 9 10 11 12 B 8 7 8 10 7 3 3 2 1 2 2 4 int a +6000 X 14 10 10 14 13 7 7 6 4 4 2 2 z 6 5 5 7 4 2 1 4 3 9 9 13 10 8 10 12 9 5 4 3 2 4 2 5 18 Table 4 Relationship of Size of Store with Net Profit as a Percent of Sales Net Profit (%) Sales Area, Sq. Ft 10000 15000 20000 3.5 3.0 2.7


