

Question: I need help with these problems (Liquidity analysis) When firms enter into loan agreements with their bank, it is very common for the agreement to
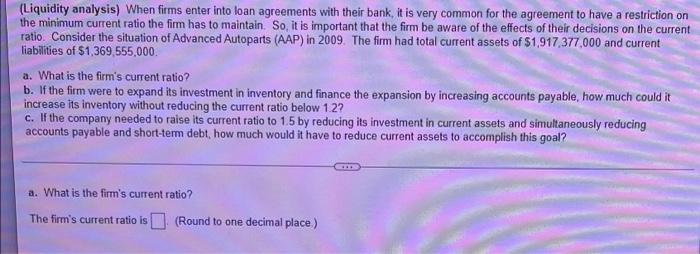
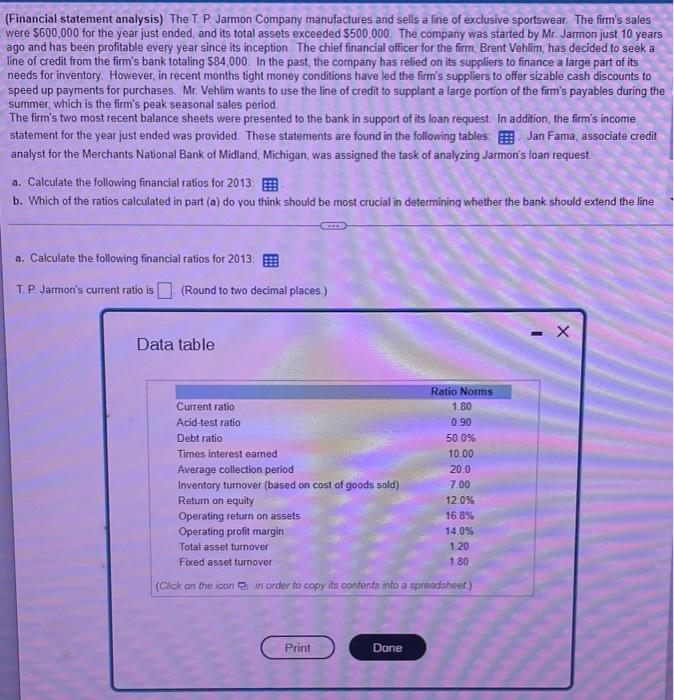
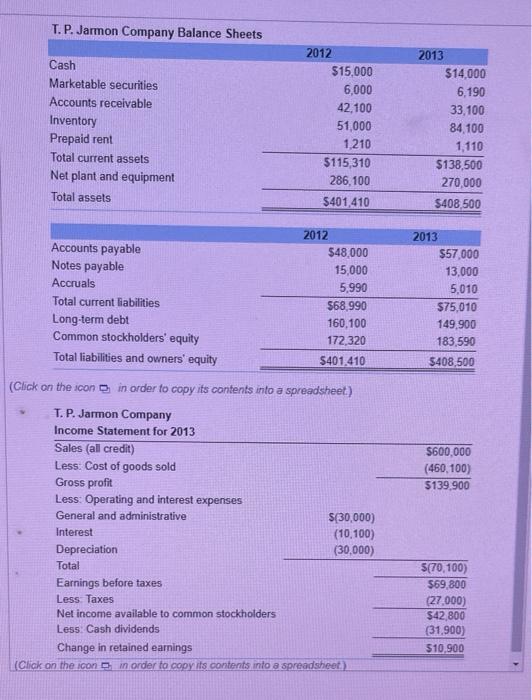
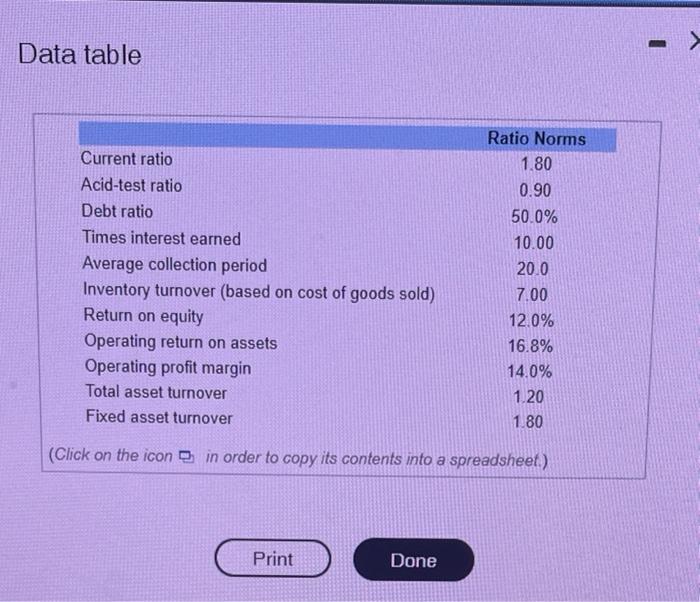
(Liquidity analysis) When firms enter into loan agreements with their bank, it is very common for the agreement to have a restriction on the minimum current ratio the firm has to maintain. So, it is important that the firm be aware of the effects of their decisions on the current ratio. Consider the situation of Advanced Autoparts (AAP) in 2009. The firm had total current assets of $1,917,377,000 and current liabilities of $1,369,555,000. a. What is the firm's current ratio? b. If the firm were to expand its investment in inventory and finance the expansion by increasing accounts payable, how much could it increase its inventory without reducing the current ratio below 1.2? c. If the company needed to raise its current ratio to 1.5 by reducing its investment in current assets and simultaneously reducing accounts payable and short-term debt, how much would it have to reduce current assets to accomplish this goal? a. What is the firm's current ratio? The firm's current ratio is (Round to one decimal place.) (Financial statement analysis) The T. P. Jarmon Company manufactures and sells a line of exclusive sportswear. The firm's sales were $600,000 for the year just ended, and its total assets exceeded $500,000. The company was started by Mr. Jarmon just 10 years ago and has been profitable every year since its inception. The chief financial officer for the firm, Brent Vehlim, has decided to seek a line of credit from the firm's bank totaling $84,000. In the past, the company has relied on its suppliers to finance a large part of its needs for inventory. However, in recent months tight money conditions have led the firm's suppliers to offer sizable cash discounts to speed up payments for purchases. Mr. Vehlim wants to use the line of credit to supplant a large portion of the firm's payables during the summer, which is the firm's peak seasonal sales period. The firm's two most recent balance sheets were presented to the bank in support of its loan request. In addition, the firm's income statement for the year just ended was provided. These statements are found in the following tables Jan Fama, associate credit analyst for the Merchants National Bank of Midland, Michigan, was assigned the task of analyzing Jarmon's loan request a. Calculate the following financial ratios for 2013 b. Which of the ratios calculated in part (a) do you think should be most crucial in determining whether the bank should extend the line CICLIS a. Calculate the following financial ratios for 2013: T. P. Jarmon's current ratio is (Round to two decimal places.) - X Data table Ratio Norms Current ratio 1.80 Acid-test ratio 0.90 Debt ratio 50.0% Times interest earned 10.00 Average collection period 20.0 Inventory turnover (based on cost of goods sold) 7.00 Return on equity 12.0% Operating return on assets 16.8% Operating profit margin 14.0% Total asset turnover 1.20 Fixed asset turnover 1.80 (Click on the icon in order to copy its contents into a spreadsheet) Print Done T. P. Jarmon Company Balance Sheets Cash $15,000 Marketable securities 6,000 Accounts receivable 42,100 51,000 Inventory Prepaid rent 1,210 Total current assets $115,310 Net plant and equipment 286,100 Total assets $401,410 Accounts payable $48,000 Notes payable 15,000 Accruals 5,990 Total current liabilities $68,990 Long-term debt 160,100 Common stockholders' equity 172,320 Total liabilities and owners' equity $401,410 (Click on the icon in order to copy its contents into a spreadsheet.) T. P. Jarmon Company Income Statement for 2013 Sales (all credit) Less: Cost of goods sold Gross profit Less: Operating and interest expenses General and administrative $(30,000) Interest (10,100) Depreciation (30,000) Total Earnings before taxes Less: Taxes Net income available to common stockholders Less: Cash dividends Change in retained earnings (Click on the icon in order to copy its contents into a spreadsheet) 2012 2012 2013 $14,000 6,190 33,100 84,100 1,110 $138,500 270,000 $408,500 $57,000 13,000 5,010 $75,010 149,900 183,590 $408,500 $600,000 (460,100) $139,900 S(70,100) $69,800 (27,000) $42,800 (31,900) $10,900 2013 Data table Ratio Norms Current ratio 1.80 Acid-test ratio 0.90 Debt ratio 50.0% Times interest earned 10.00 Average collection period 20.0 Inventory turnover (based on cost of goods sold) 7.00 Return on equity 12.0% Operating return on assets 16.8% Operating profit margin 14.0% Total asset turnover 1.20 Fixed asset turnover 1.80 (Click on the icon in order to copy its contents into a spreadsheet.) Print Done mm
Step by Step Solution
There are 3 Steps involved in it

Get step-by-step solutions from verified subject matter experts