

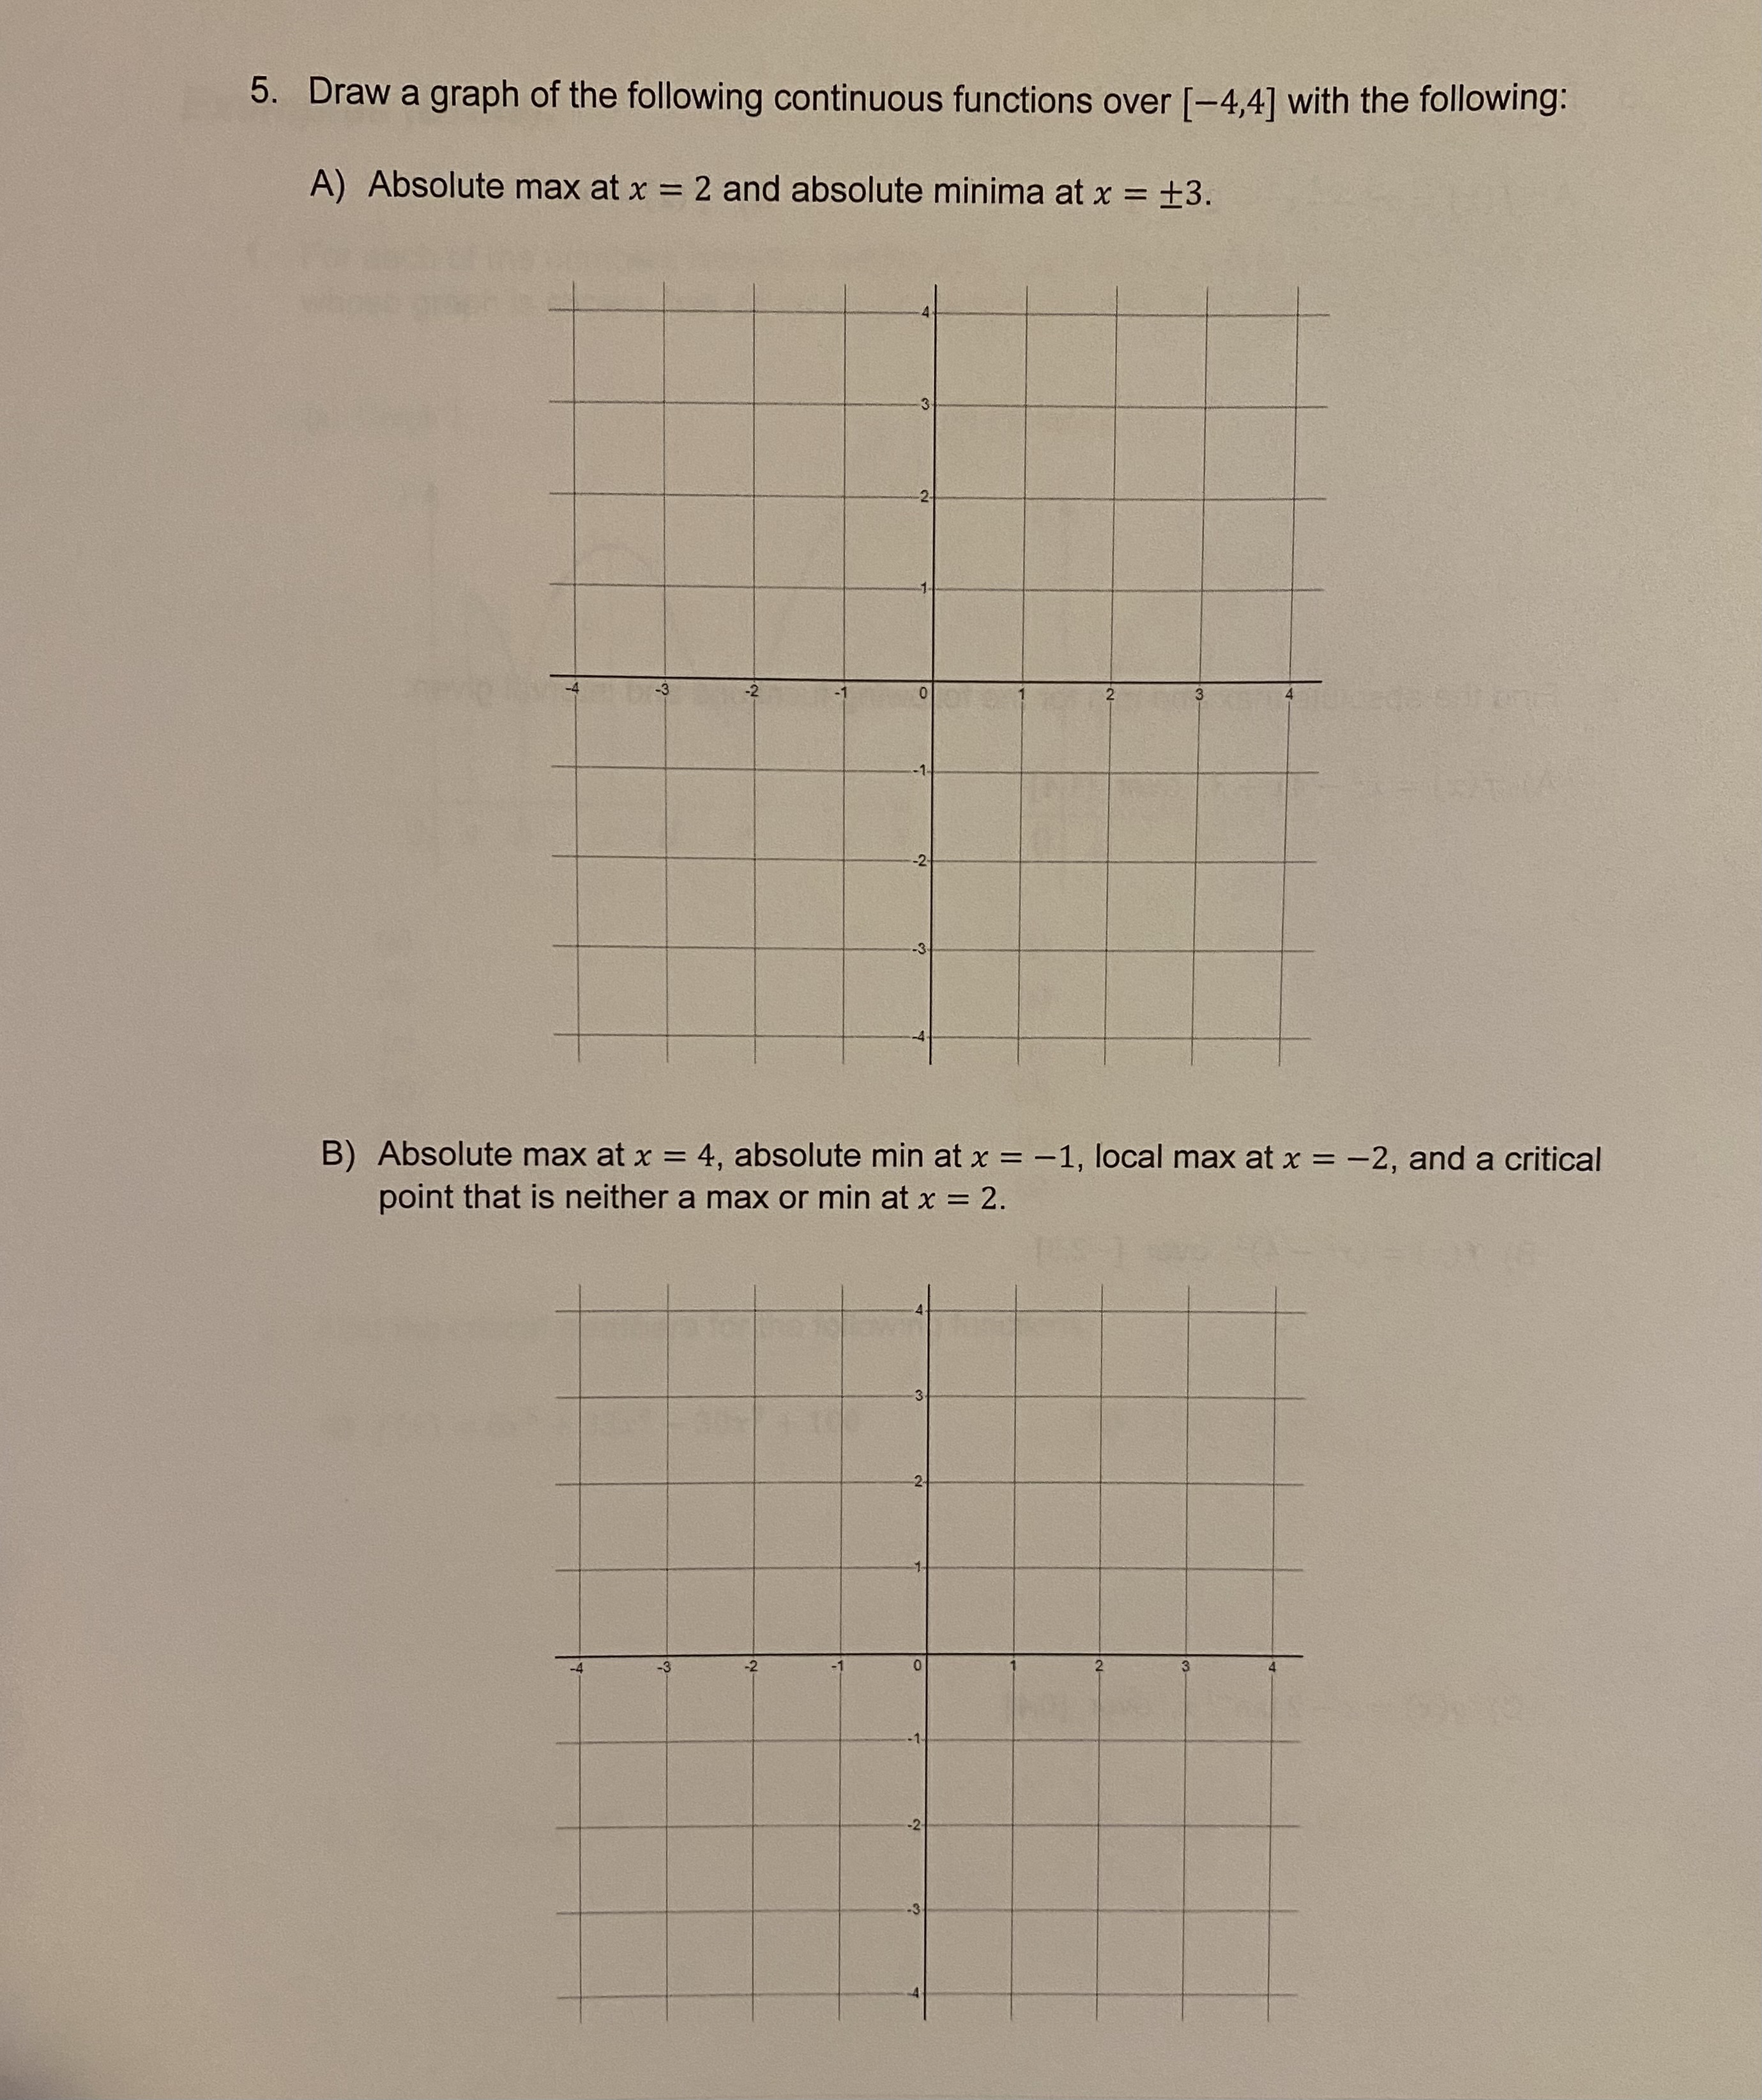
Question: I need help with these questions 5. Draw a graph of the following continuous functions over [-4,4] with the following: A) Absolute max at x

![the following continuous functions over [-4,4] with the following: A) Absolute max](https://s3.amazonaws.com/si.experts.images/answers/2024/06/66797e6f1312f_25466797e6edb3f5.jpg)


I need help with these questions
![f (x) = 2x2 - 8x +6, [1,3]. 2. Suppose a ball](https://s3.amazonaws.com/si.experts.images/answers/2024/06/66797e72cd358_25866797e72a588a.jpg)
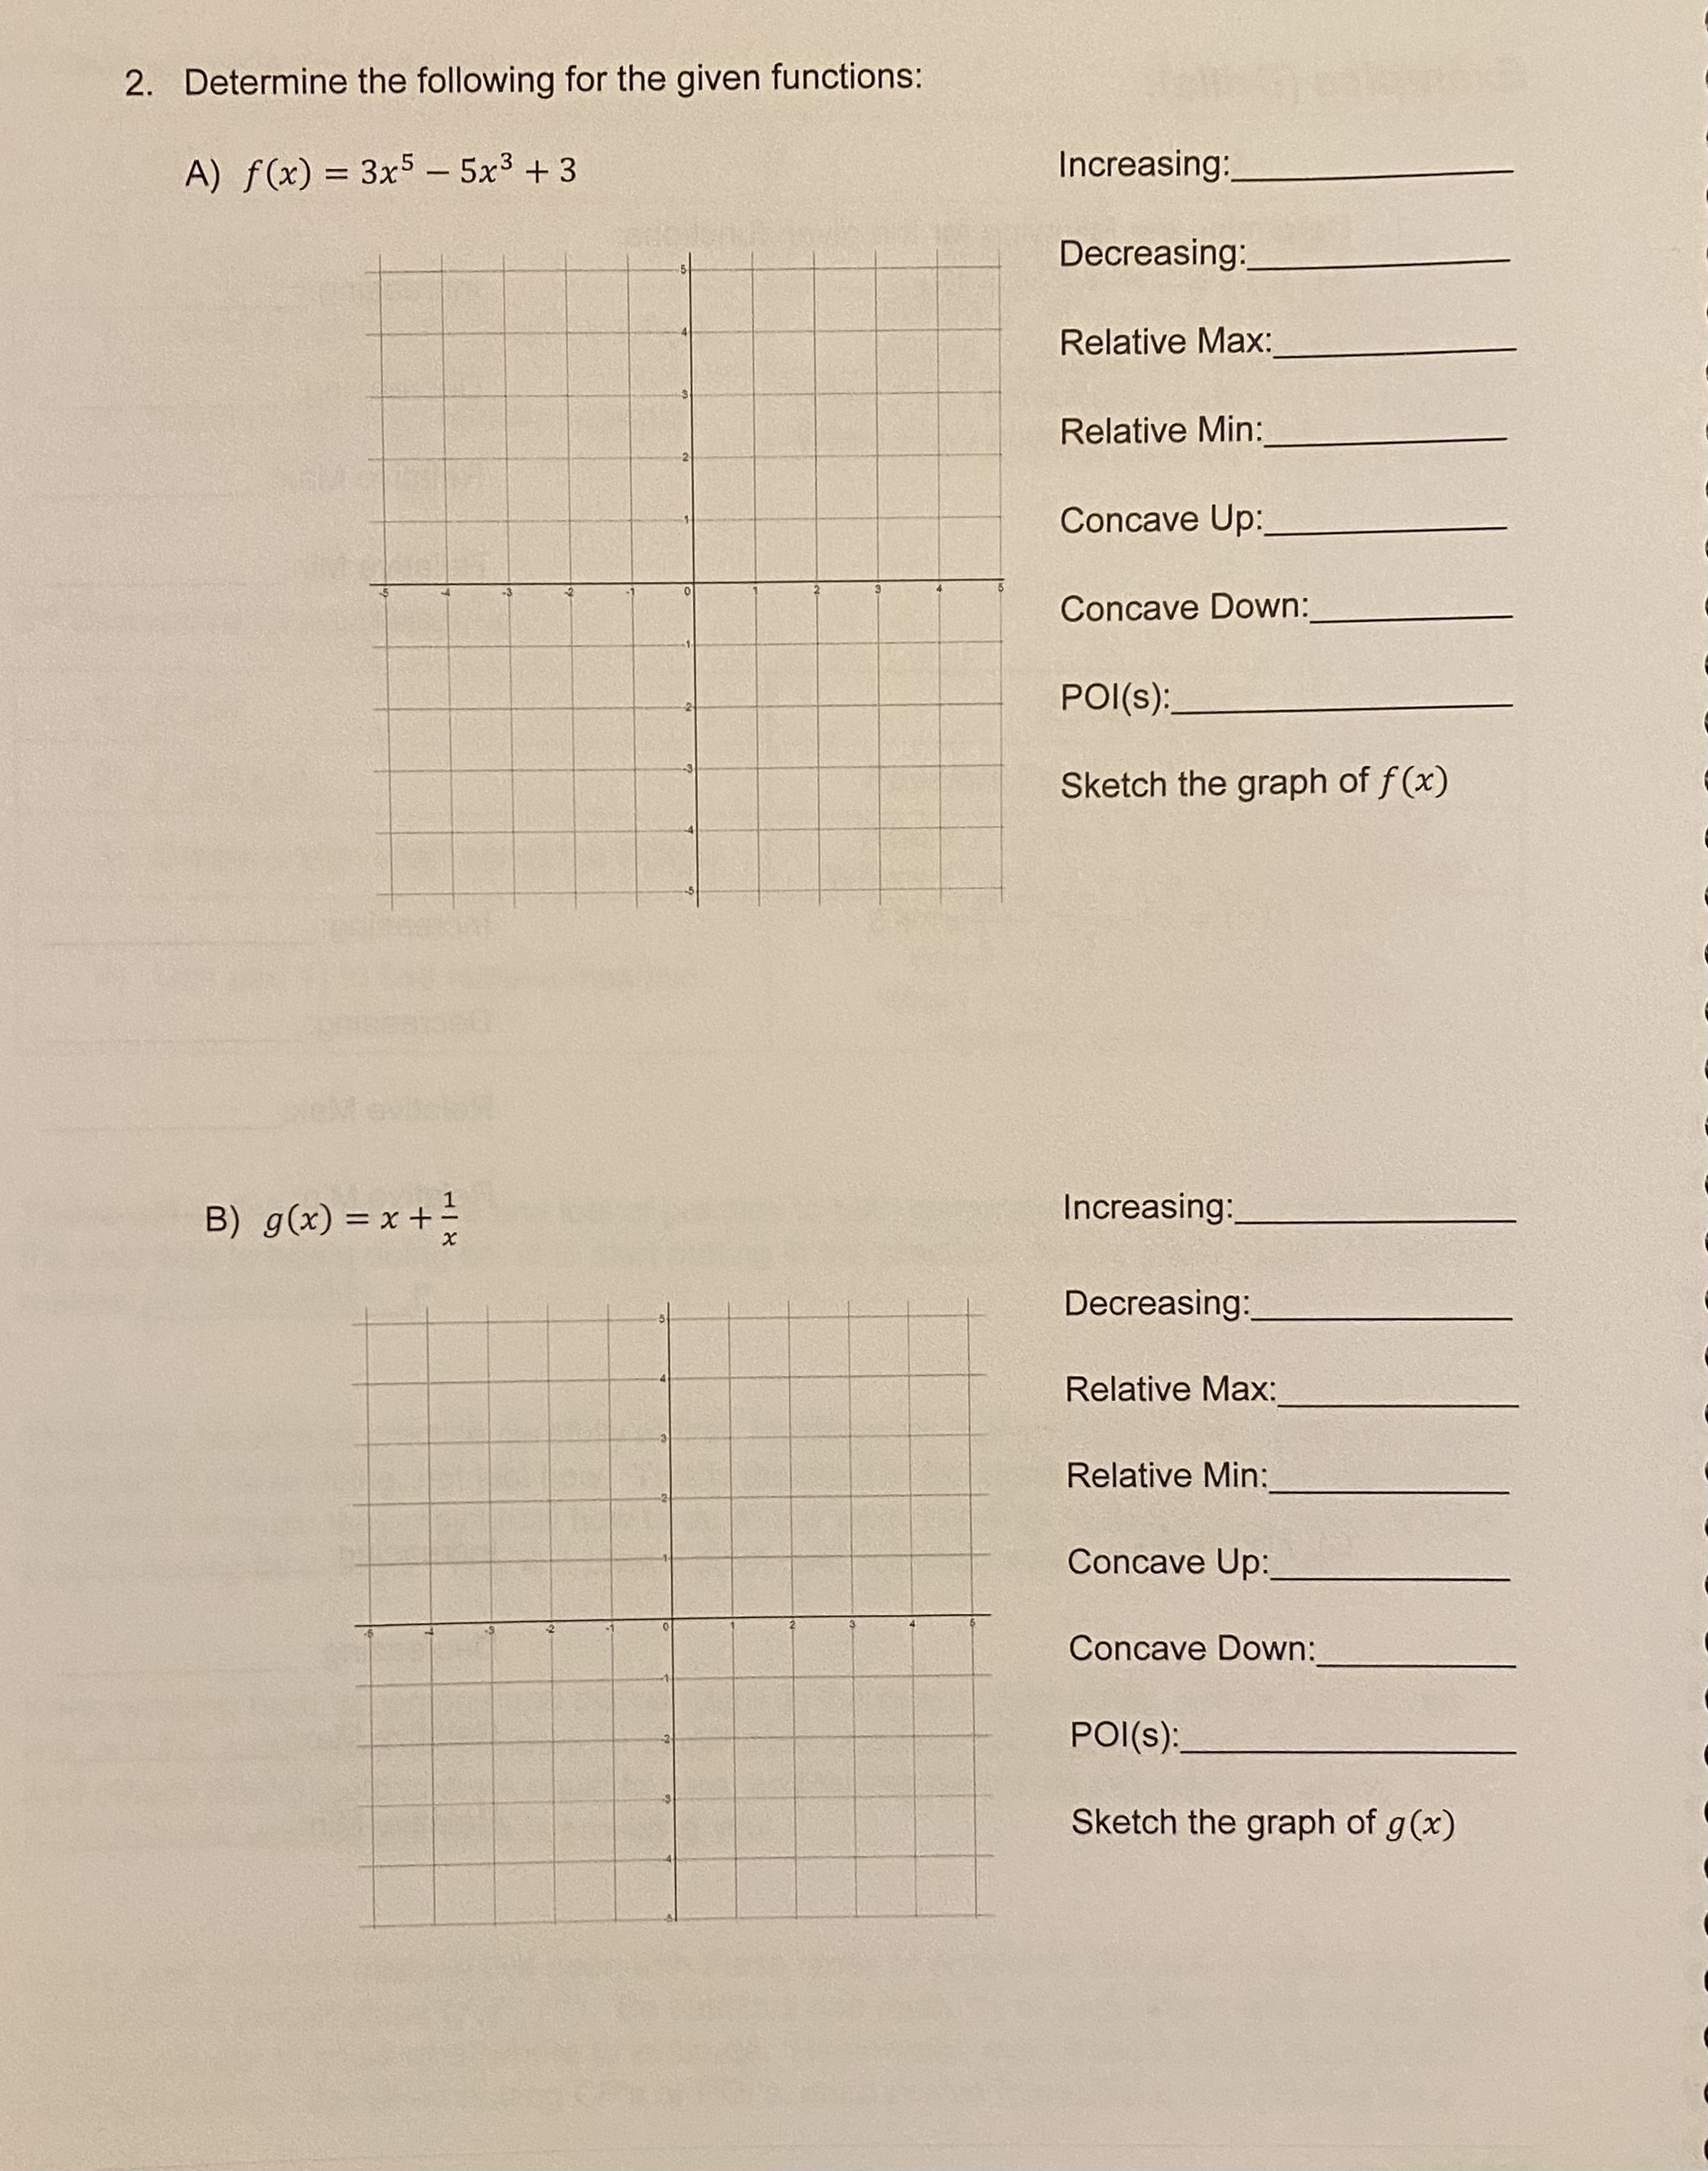
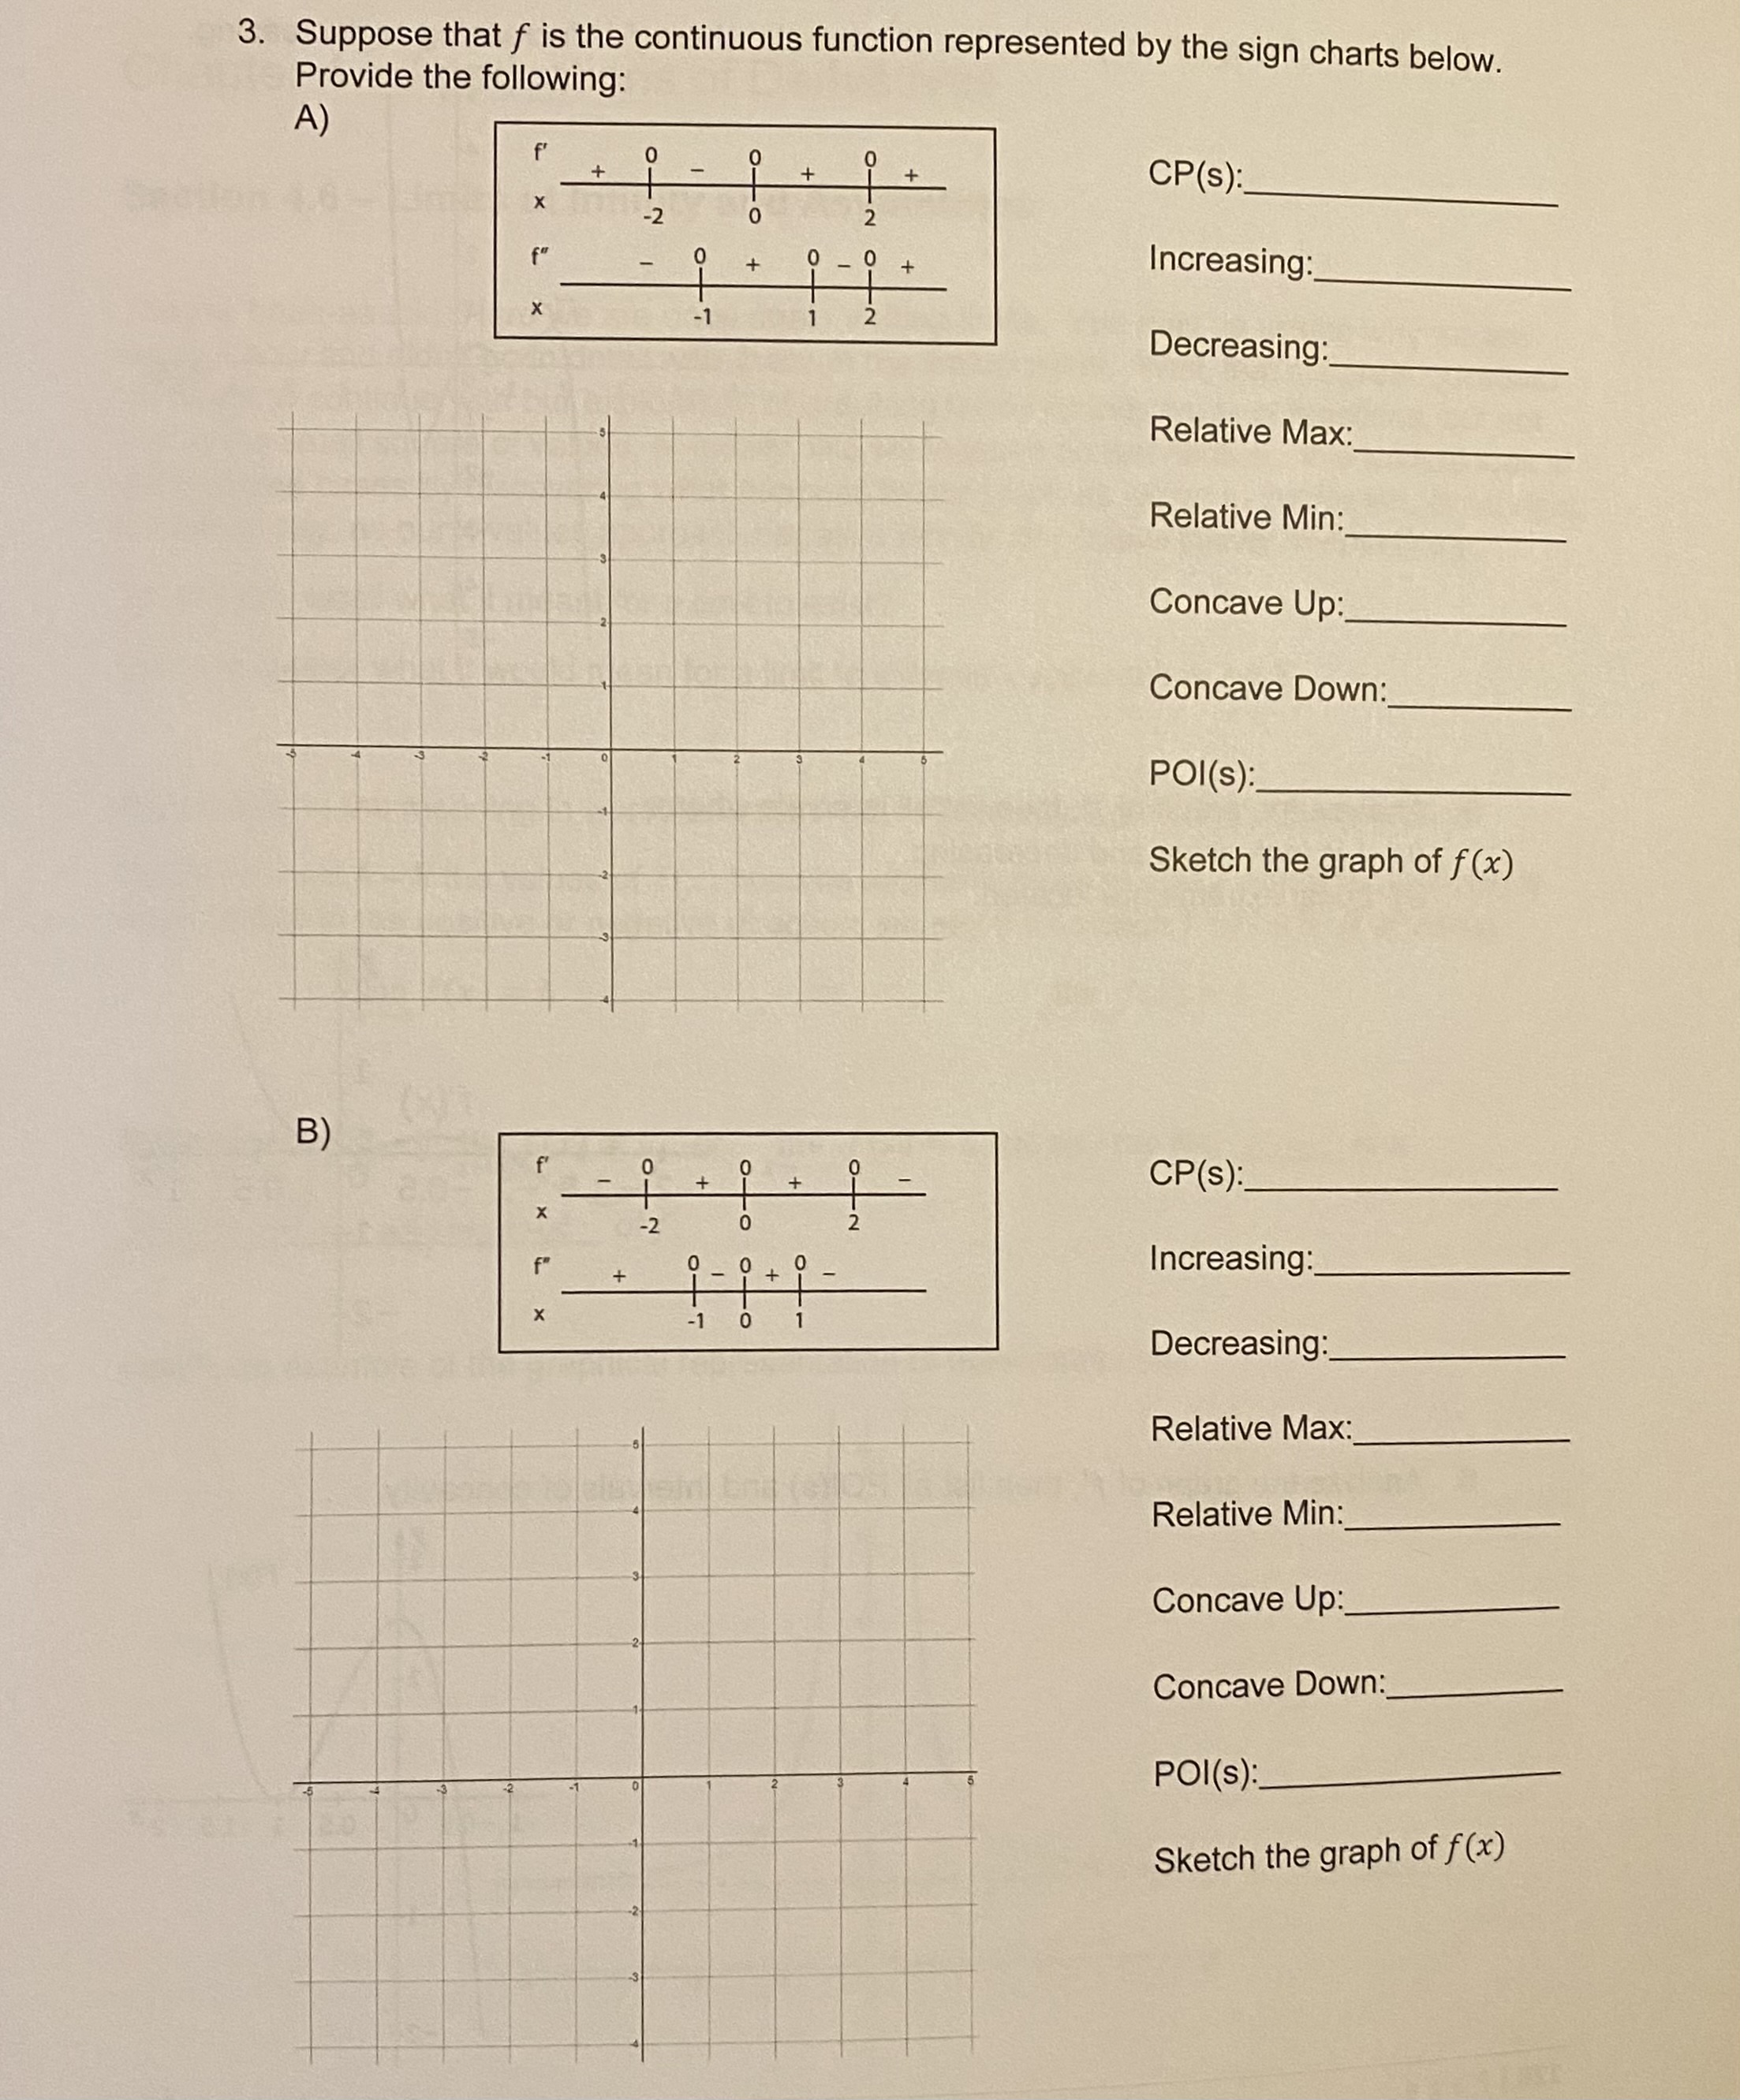
5. Draw a graph of the following continuous functions over [-4,4] with the following: A) Absolute max at x = 2 and absolute minima at x = $3. B) Absolute max at x = 4, absolute min at x = -1, local max at x = -2, and a critical point that is neither a max or min at x = 2.1. Find all values of c guaranteed by Rolle's Theorem for the given function & interval: f (x) = 2x2 - 8x +6, [1,3]. 2. Suppose a ball is dropped from a height of 200 ft. Its position at time t is s(t) = -16t2 + 200. Find the time t when the instantaneous velocity of the ball equals its average velocity. 3. Let f(x) = 2x3 + 3x2 -12x. Find all values of c that satisfy the MVT over [-1,2].4. Suppose you drive from Fresno to Chowchilla (approximately 40 mi) in 30 minutes. When you get there a CHP officer can give you a ticket for going 80 mph "somewhere on highway 99". Is that fair? Why or why not? (Would that hold in court?) 5. Determine the following for the function: f (x) = x3 - 12x + 5 A) Intervals f increases: B) Intervals f decreases: C) Relative maximum: D) Relative minimum: E) Sketch the graph of f:1. Determine the following for the given functions: A) f (x ) =-x3+2x2 + 18x Increasing: Decreasing Relative Max: Relative Min: B) f(x) = x5 40 2 x3 + 5 Increasing: Decreasing: Relative Max: Relative Min: Increasing C) f (x ) =* Decreasing: Relative Max: Relative Min:2. Determine the following for the given functions: A) f(x) = 3x5-5x3 +3 Increasing: Decreasing: Relative Max: Relative Min: Concave Up: Concave Down: POI(s): Sketch the graph of f (x) B) g(x) = x+ Increasing: Decreasing: Relative Max: Relative Min: Concave Up: Concave Down: POI(s): Sketch the graph of g(x)3. Suppose that f is the continuous function represented by the sign charts below. Provide the following: A) CP(s): Increasing: Decreasing: Relative Max: Relative Min: Concave Up: Concave Down: POI(s): Sketch the graph of f (x) B) CP(s) Increasing: Decreasing: Relative Max: Relative Min: Concave Up: Concave Down: POI(s): Sketch the graph of f (x)
Step by Step Solution
There are 3 Steps involved in it

Get step-by-step solutions from verified subject matter experts