

Question: I need help with these questions data at the bottom 1. Find the mean, median, mode, standard deviation, Q1, Q3 and IRQ for the quantitative
I need help with these questions data at the bottom 1. Find the mean, median, mode, standard deviation, Q1, Q3 and IRQ for the quantitative variable for each value of the qualitative variablesl2. Construct a boxplot of all the observation of the variable 3.Construct a histogram of all the observation of the quantitative variable. Base on your histogram construct a frequency table4 construct side by side boxplots of the quantitative variable by the qualitative variable 5. Base on histogram does it look like the distribution is skewed to the lift, right or symmetric? Give justification by comparing the median with the mean. also, write
write sentence or two describing any other observations about the quantitative variable 6. Base on the boxplots
write sentence or two describing the quantitative by the qualitative variable includes which qualitative variable has the largest IQR and what it is 7 what percentage of data is in each of the following intervals? 8 Does this data contain any outliers? Explain show work
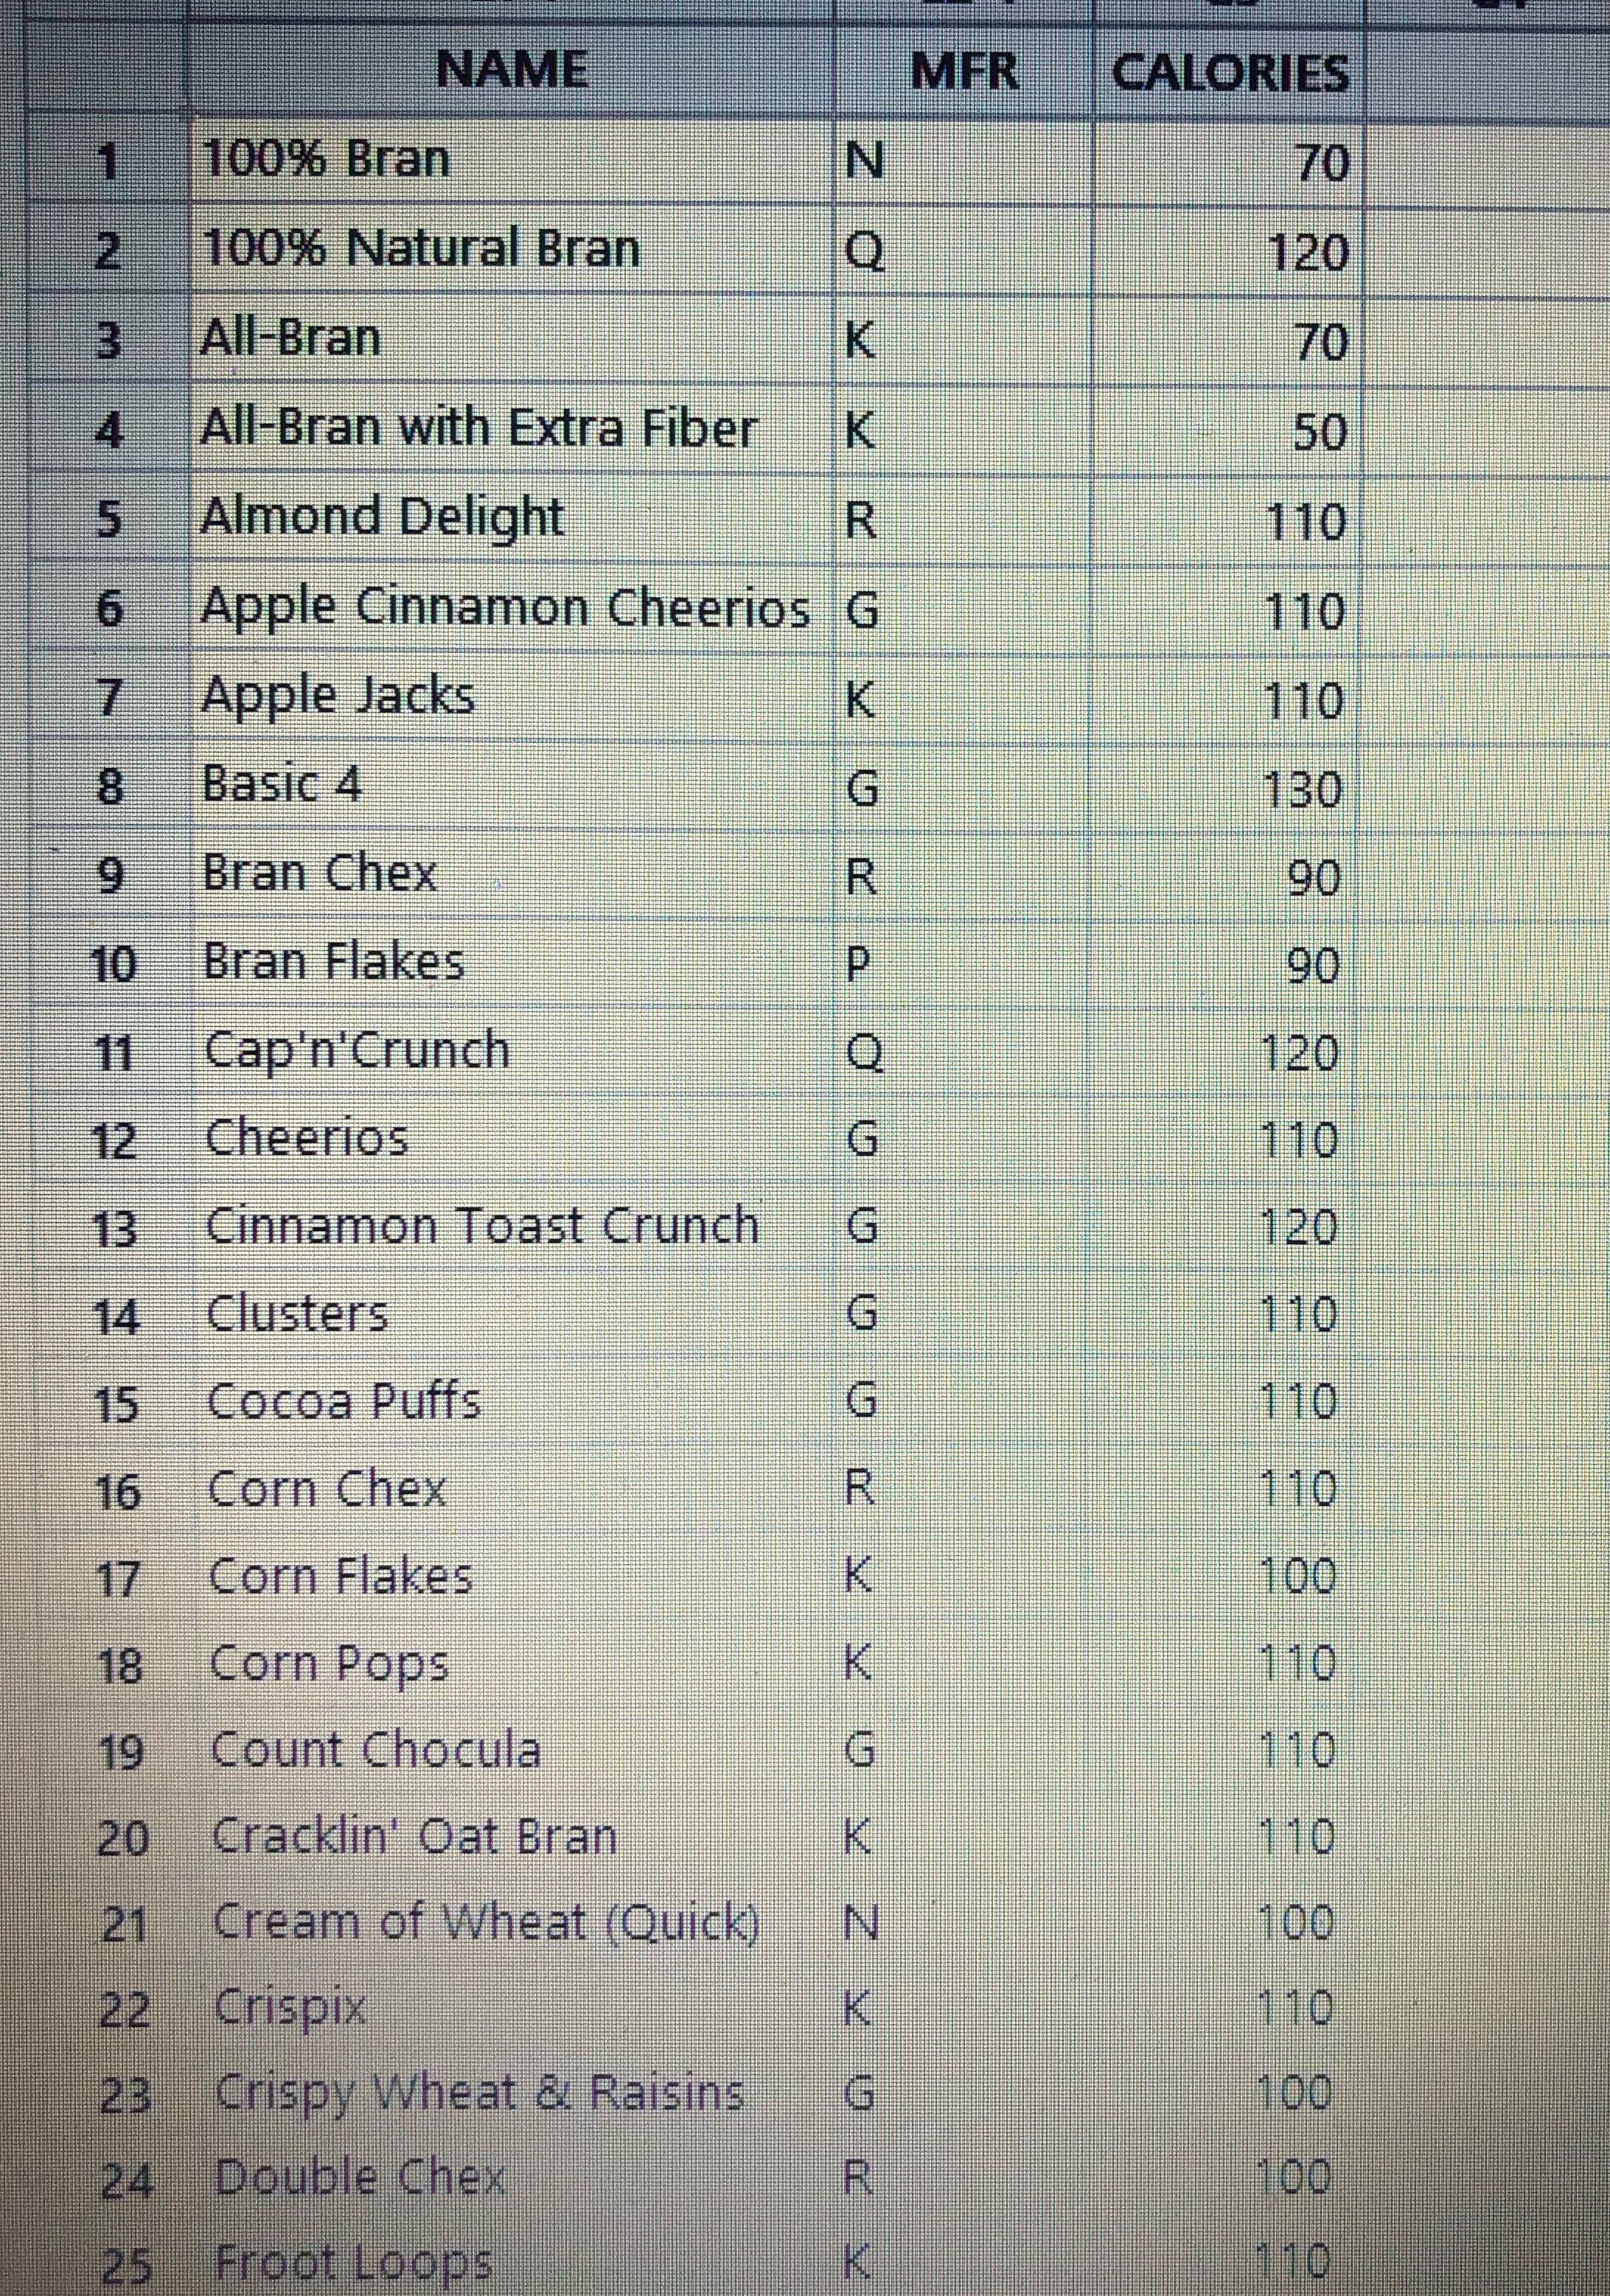
NAME MFR CALORIES 100% Bran N 70 100% Natural Bran Q 120 3 All-Bran K 70 4 All-Bran with Extra Fiber K 50 5 Almond Delight R 110 6 Apple Cinnamon Cheerios G 110 7 Apple Jacks K 110 8 Basic 4 G 130 9 Bran Chex R 90 10 Bran Flakes P 90 11 Cap'n Crunch 120 12 Cheerios 110 13 Cinnamon Toast Crunch 120 14 Clusters 110 15 Cocoa Puffs G 110 16 Corn Chex R 110 17 Corn Flakes K 100 18 Corn Pops K 110 19 Count Chocula G 110 20 Cracklin' Oat Bran 110 21 Cream of Wheat (Quick) N 100 22 Crispix K 1 10 23 Crispy Wheat & Raisins G 100 24 Double Chex 100 25 Froot Loops K 1 10
Step by Step Solution
There are 3 Steps involved in it

Get step-by-step solutions from verified subject matter experts