

Question: I need help with these questions provide grapghs using stat crunch. How would you describe the shape of this distribution? What is the mean? Use
I need help with these questions provide grapghs using stat crunch.
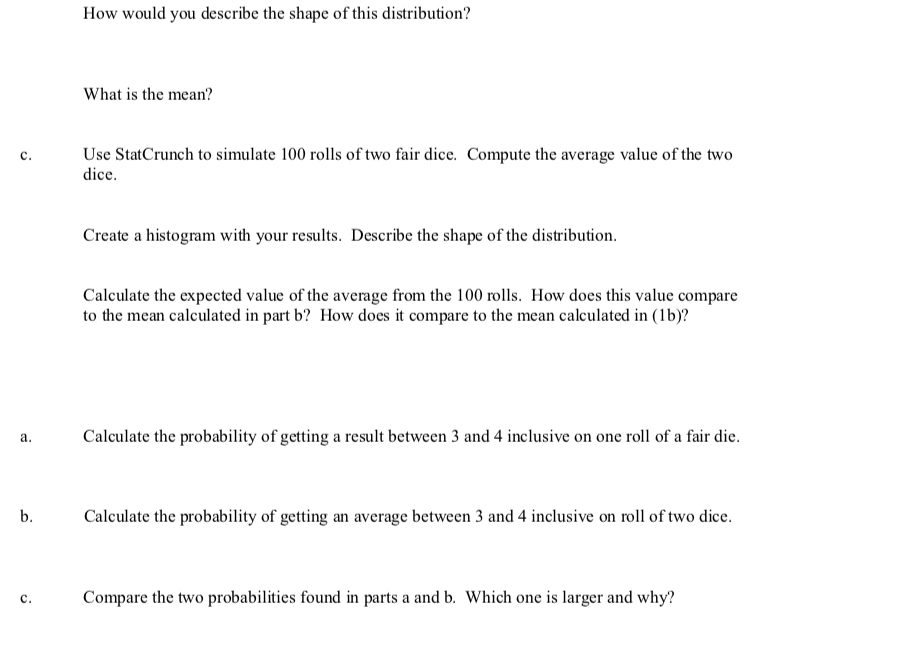
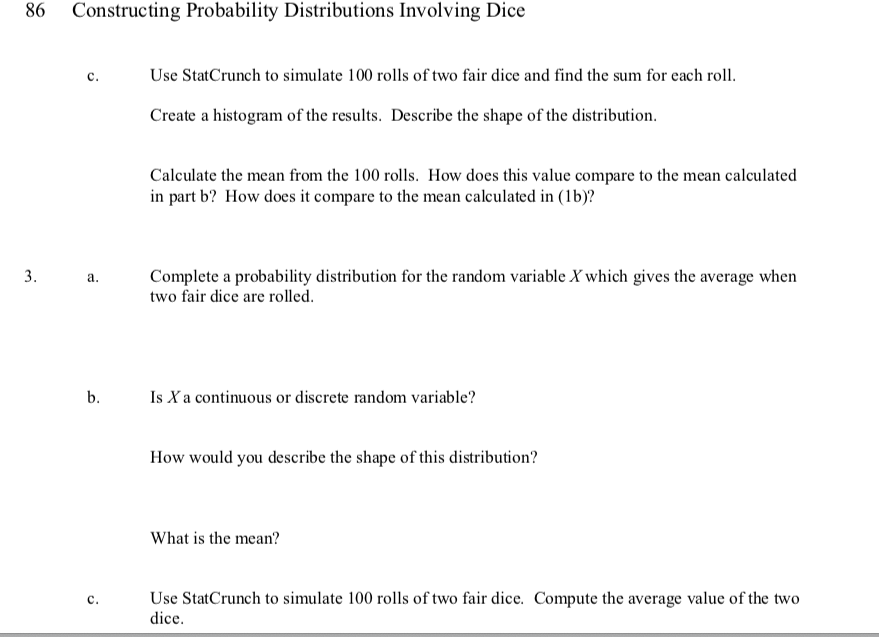
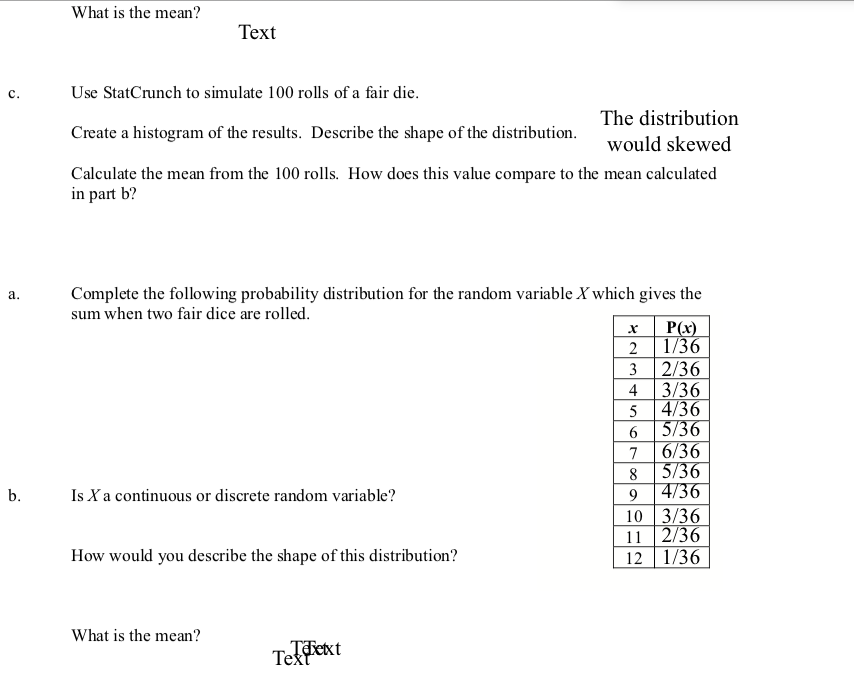
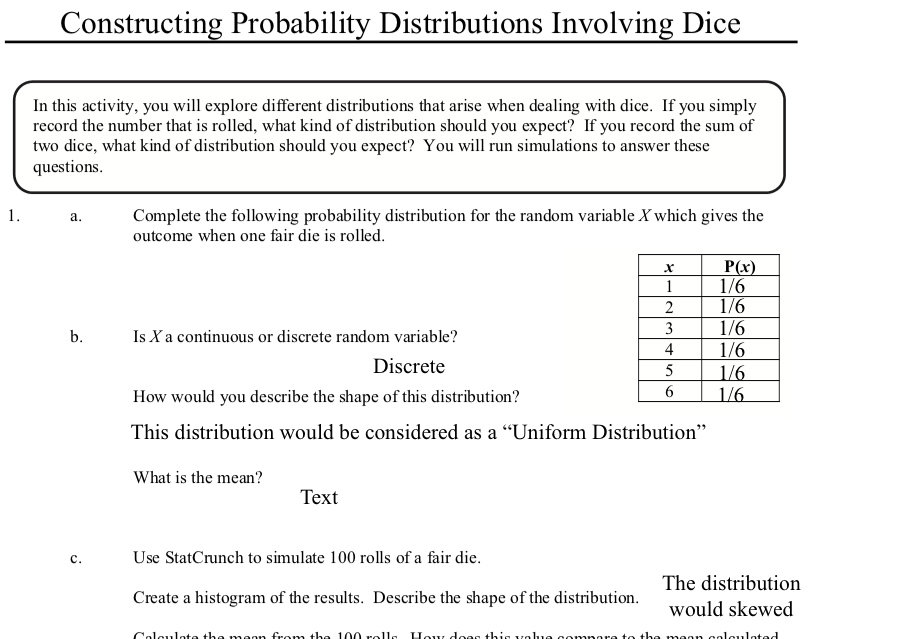
How would you describe the shape of this distribution? What is the mean? Use StatCrunch to simulate [[10 rolls oftwo fair dice. Compute the average value ofthe two dice. Create a histogram with your results. Describe the shape of the distribution. Calculate the expected value of the average from the IUD rolls. How does this value compare to the mean calculated in part b? How does it compare to the mean calculated in {lb}? Calculate the probability of getting a result between 3 and 4 inclusive on one roll of a fair die. Calculate the probability of getting an average between 3 and 4 inclusive on roll of two dice. Compare the two probabilities found in parts a and b. Which one is larger and why? 86 Constructing Probability Distributions Involving Dice c. Use StatCrunch to simulate [DU rolls oftwo fair dice and nd the sum for each roll. Create a histogram of the results. Describe the shape of the distribution. Calculate the mean from the 100 rolls. How does this value compare to the mean calculated in part b? How does it compare to the mean calculated in (lb)? 3. a. Complete a probability distribution for the random variable X which gives the average when two fair dice are rolled. b. Is X a continuous or discrete random variable? How would you describe the shape of this distribution? What is the mean? c. Use StatCrunch to simulate [00 rolls of two fair dice. Compute the average value of the two dice. What is the mean? Text C. Use StatCrunch to simulate 100 rolls of a fair die. Create a histogram of the results. Describe the shape of the distribution. The distribution would skewed Calculate the mean from the 100 rolls. How does this value compare to the mean calculated in part b? a. Complete the following probability distribution for the random variable X which gives the sum when two fair dice are rolled. X P(x) 1/36 2/36 3/36 5 4/36 6 5/36 7 6/36 8 5/36 b. Is X a continuous or discrete random variable? 9 4/36 10 3/36 11 2/36 How would you describe the shape of this distribution? 12 1/36 What is the mean? TellextConstructing Probability Distributions Involving Dice In this activity, you will explore different distributions that arise when dealing with dice. If you simply record the number that is rolled, what kind of distribution should you expect? If you record the sum of two dice, what kind of distribution should you expect? You will run simulations to answer these questions. 1. a. Complete the following probability distribution for the random variable X which gives the outcome when one fair die is rolled. X P(x) 1/6 2 1/6 b. Is X a continuous or discrete random variable? 3 1/6 Discrete 4 1/6 5 1/6 How would you describe the shape of this distribution? 6 1/6 This distribution would be considered as a "Uniform Distribution" What is the mean? Text C. Use StatCrunch to simulate 100 rolls of a fair die. Create a histogram of the results. Describe the shape of the distribution. The distribution would skewed
Step by Step Solution
There are 3 Steps involved in it

Get step-by-step solutions from verified subject matter experts