

Question: I need help with these questions: QUESTION 1 Given the following equation, what effect does the 'degree' variable have upon y y = 3 +


I need help with these questions:
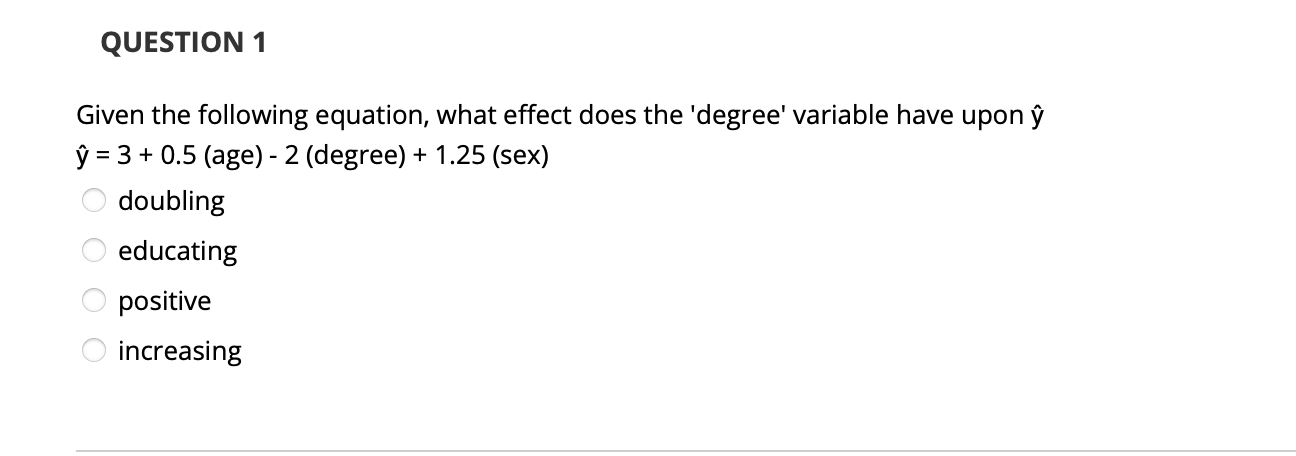
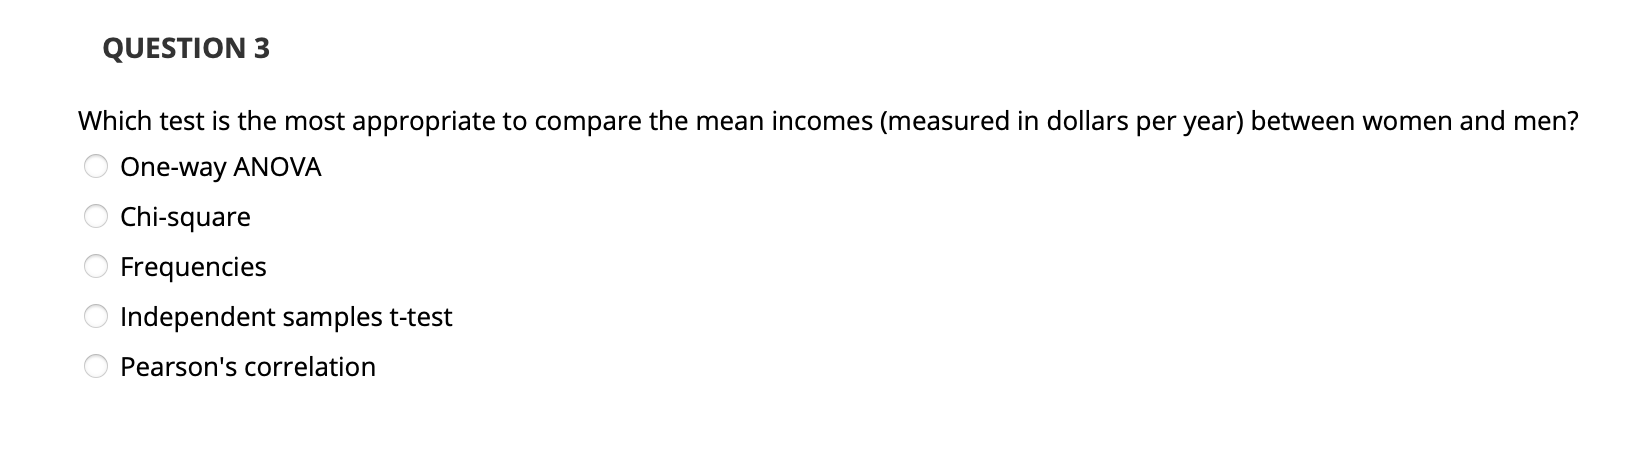

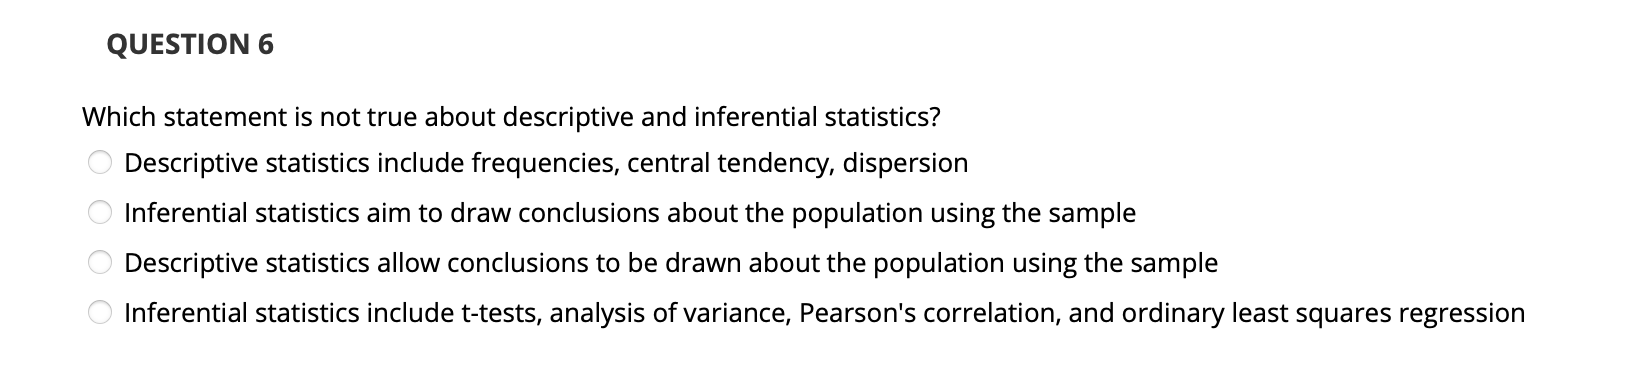
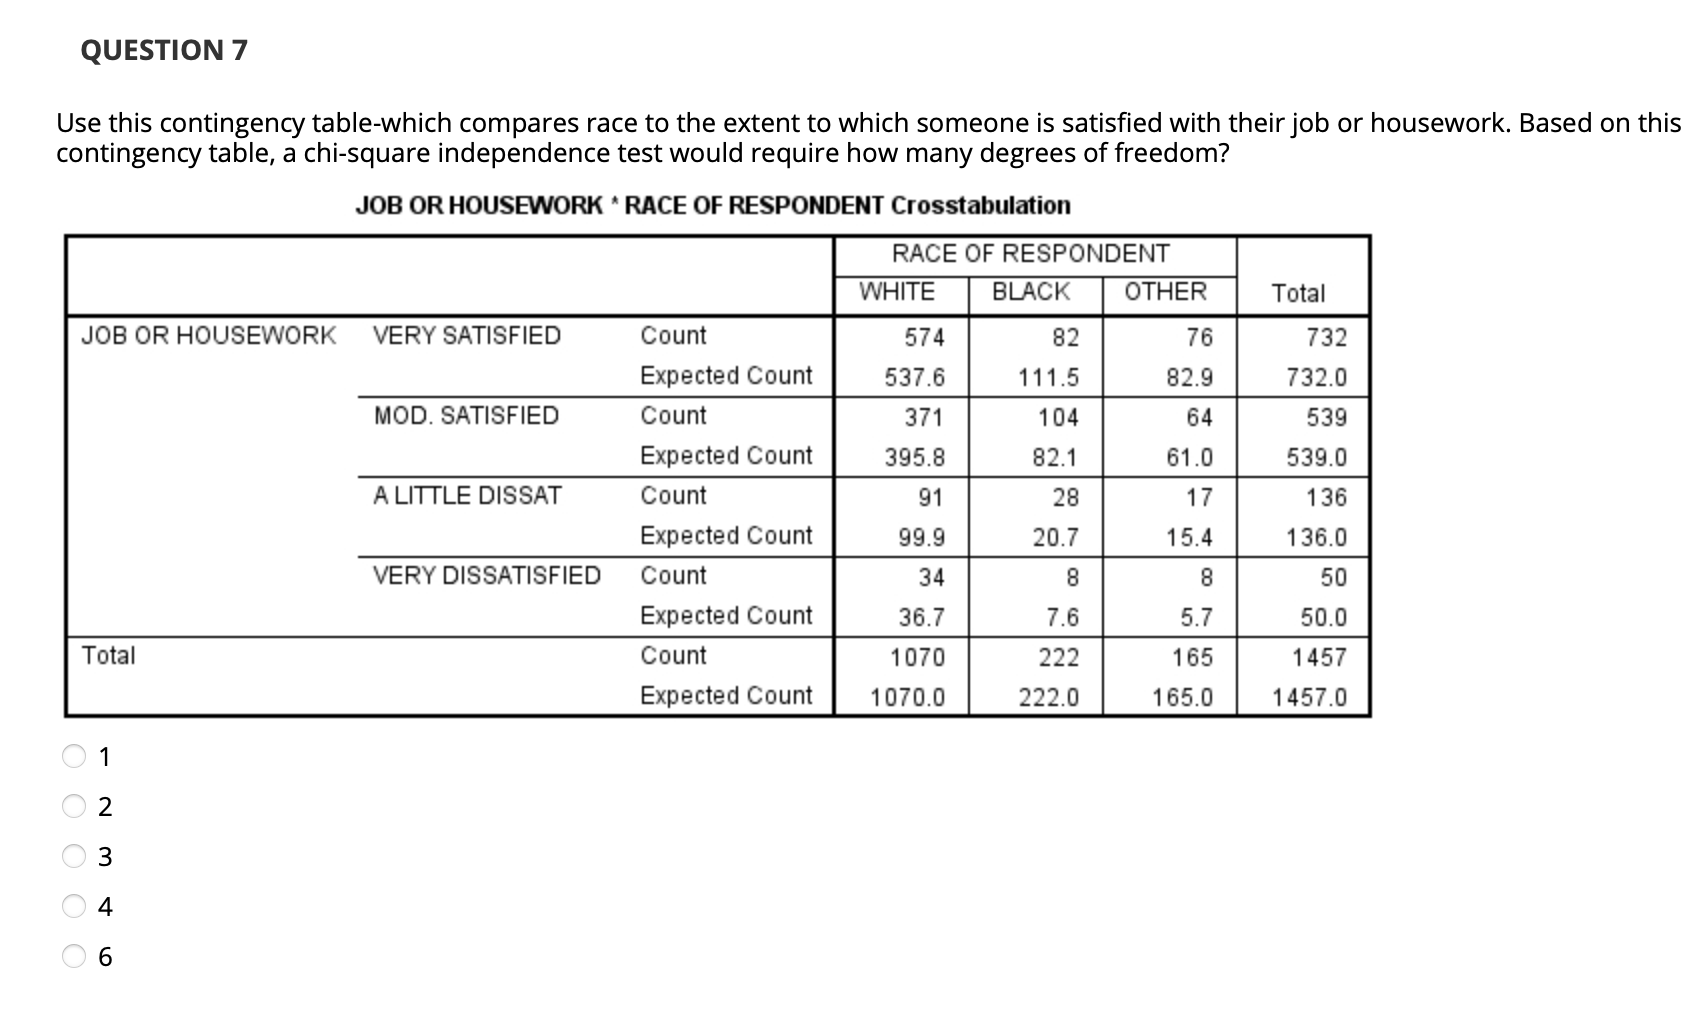
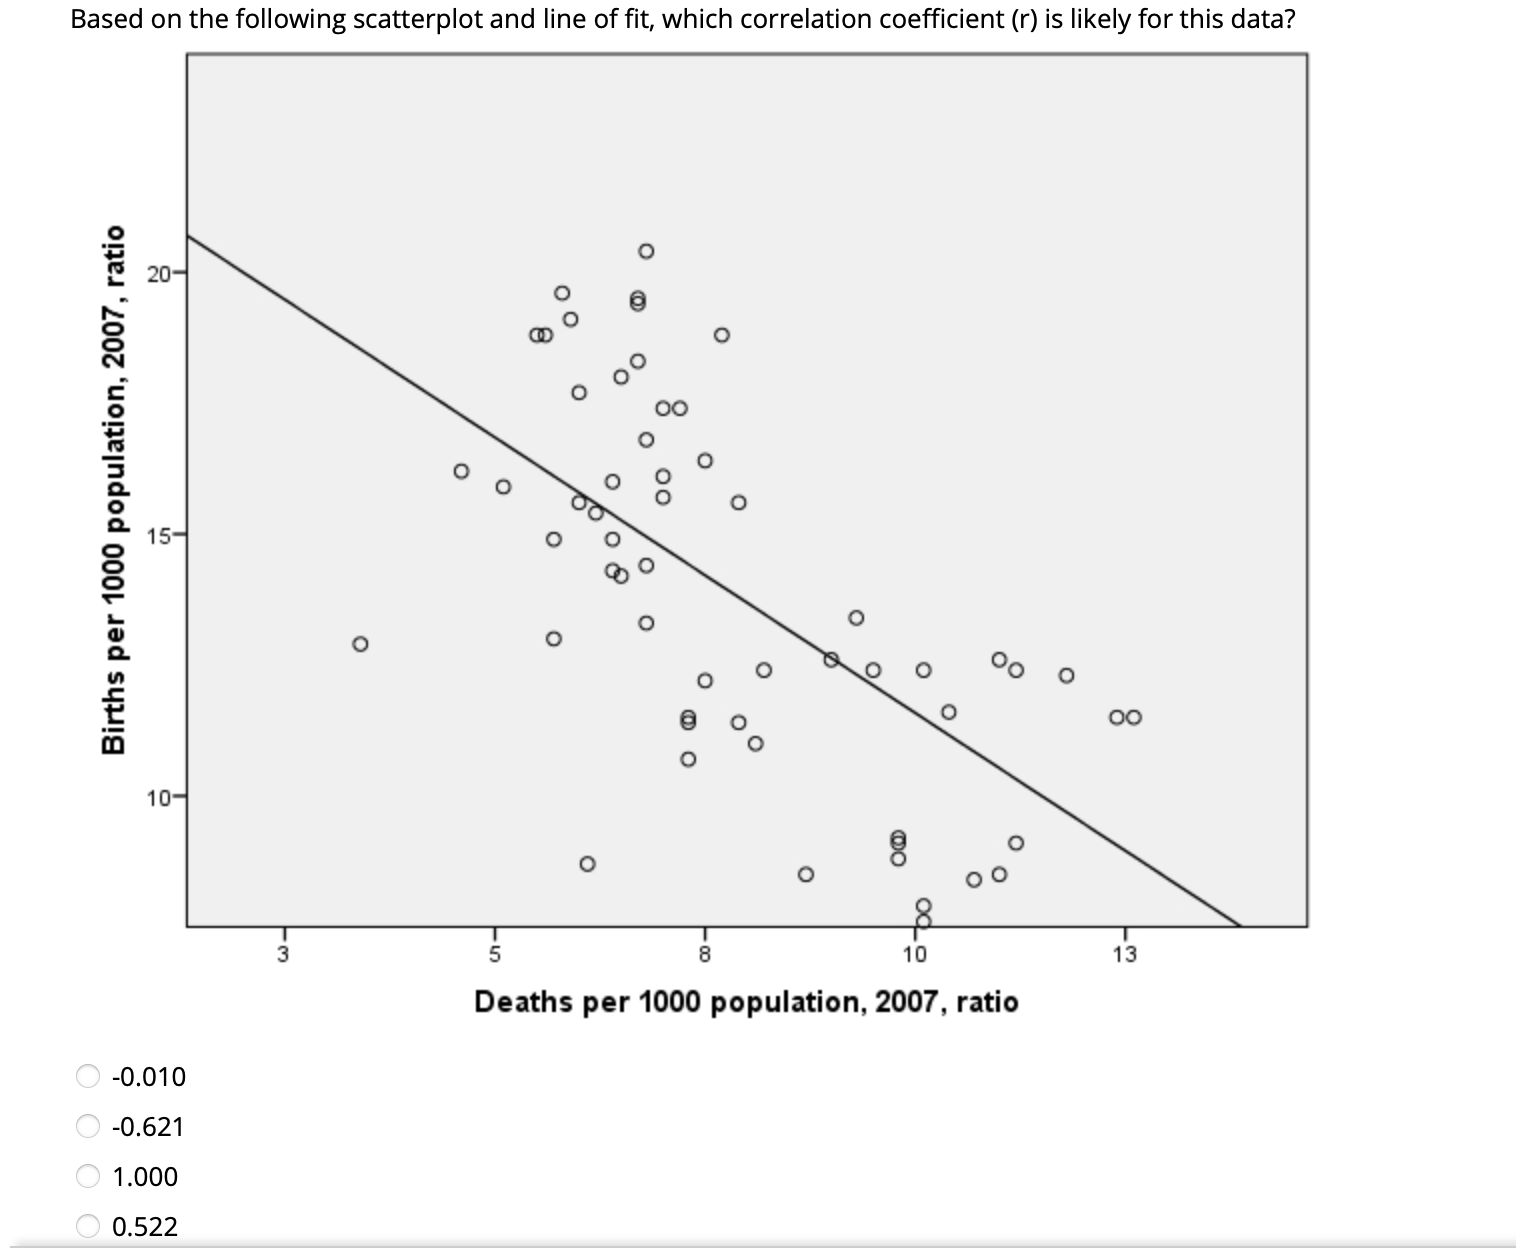
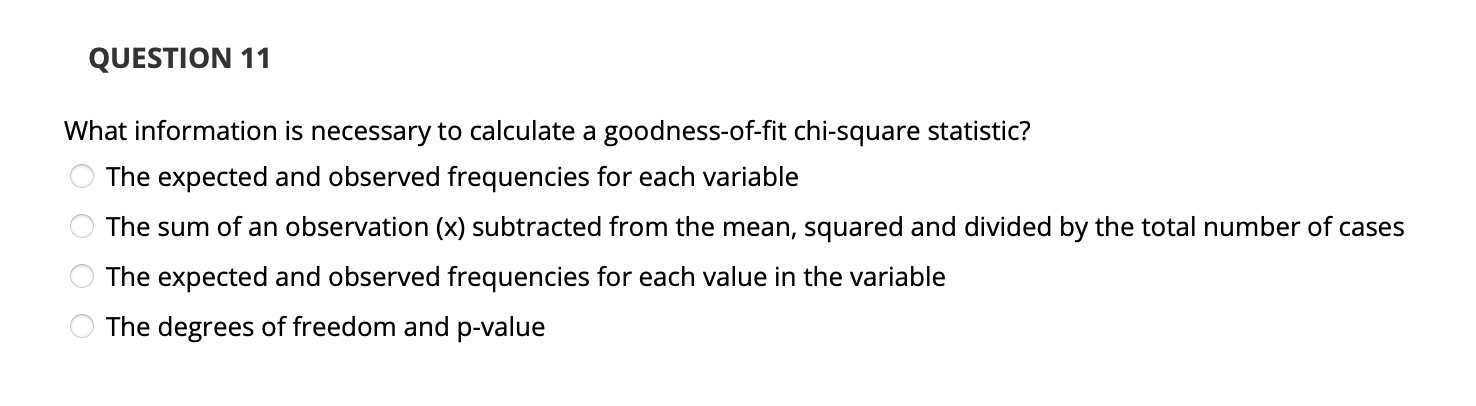
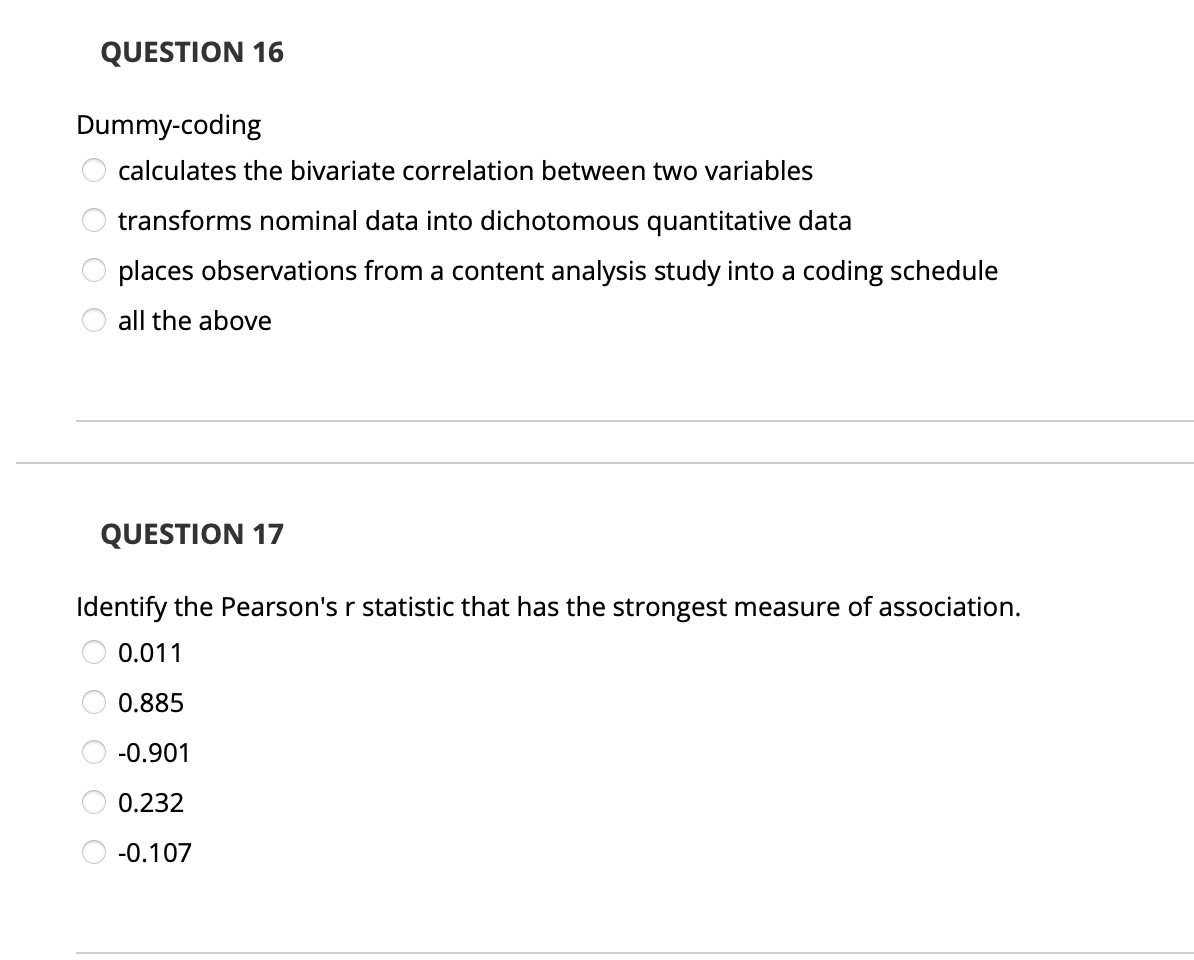

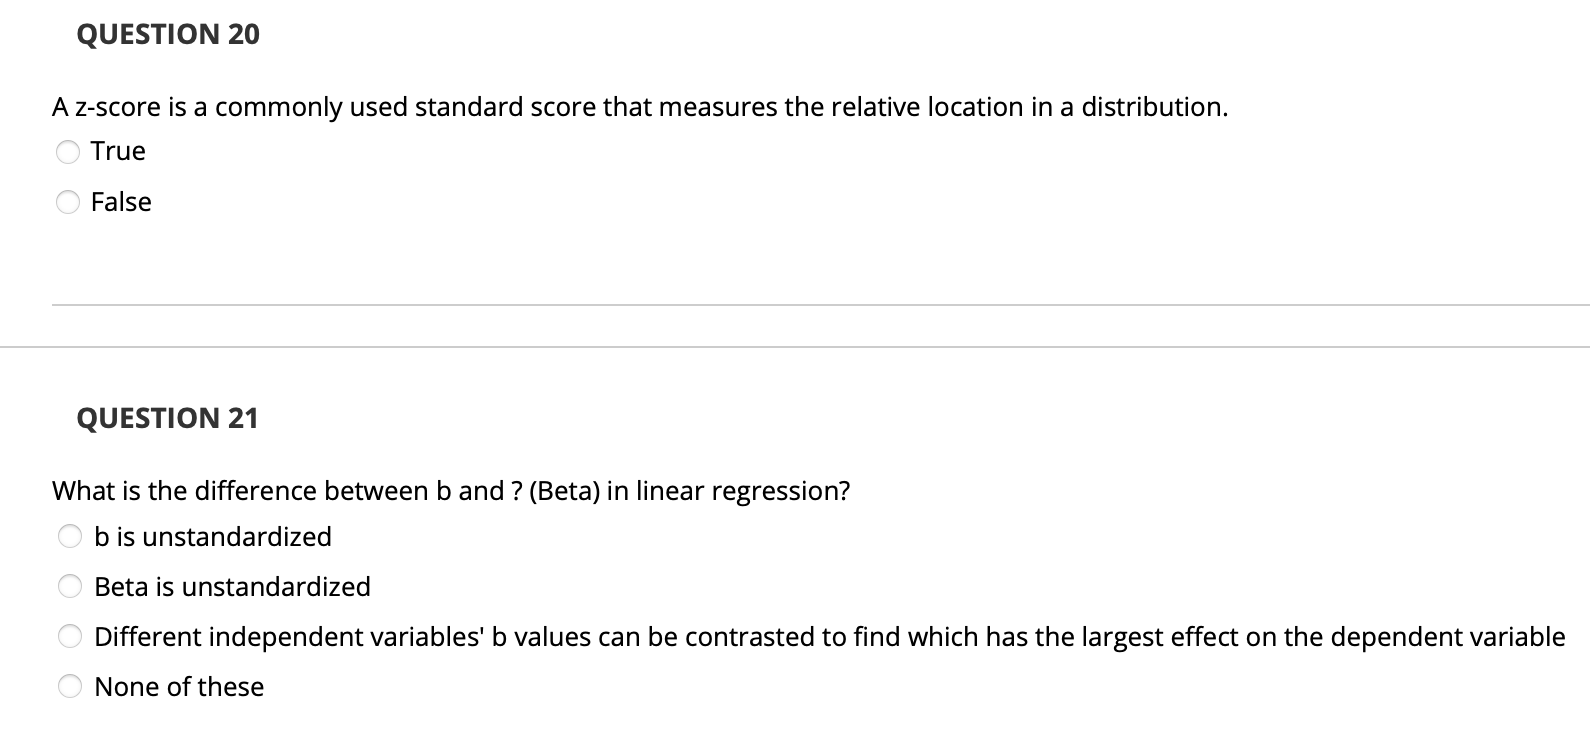


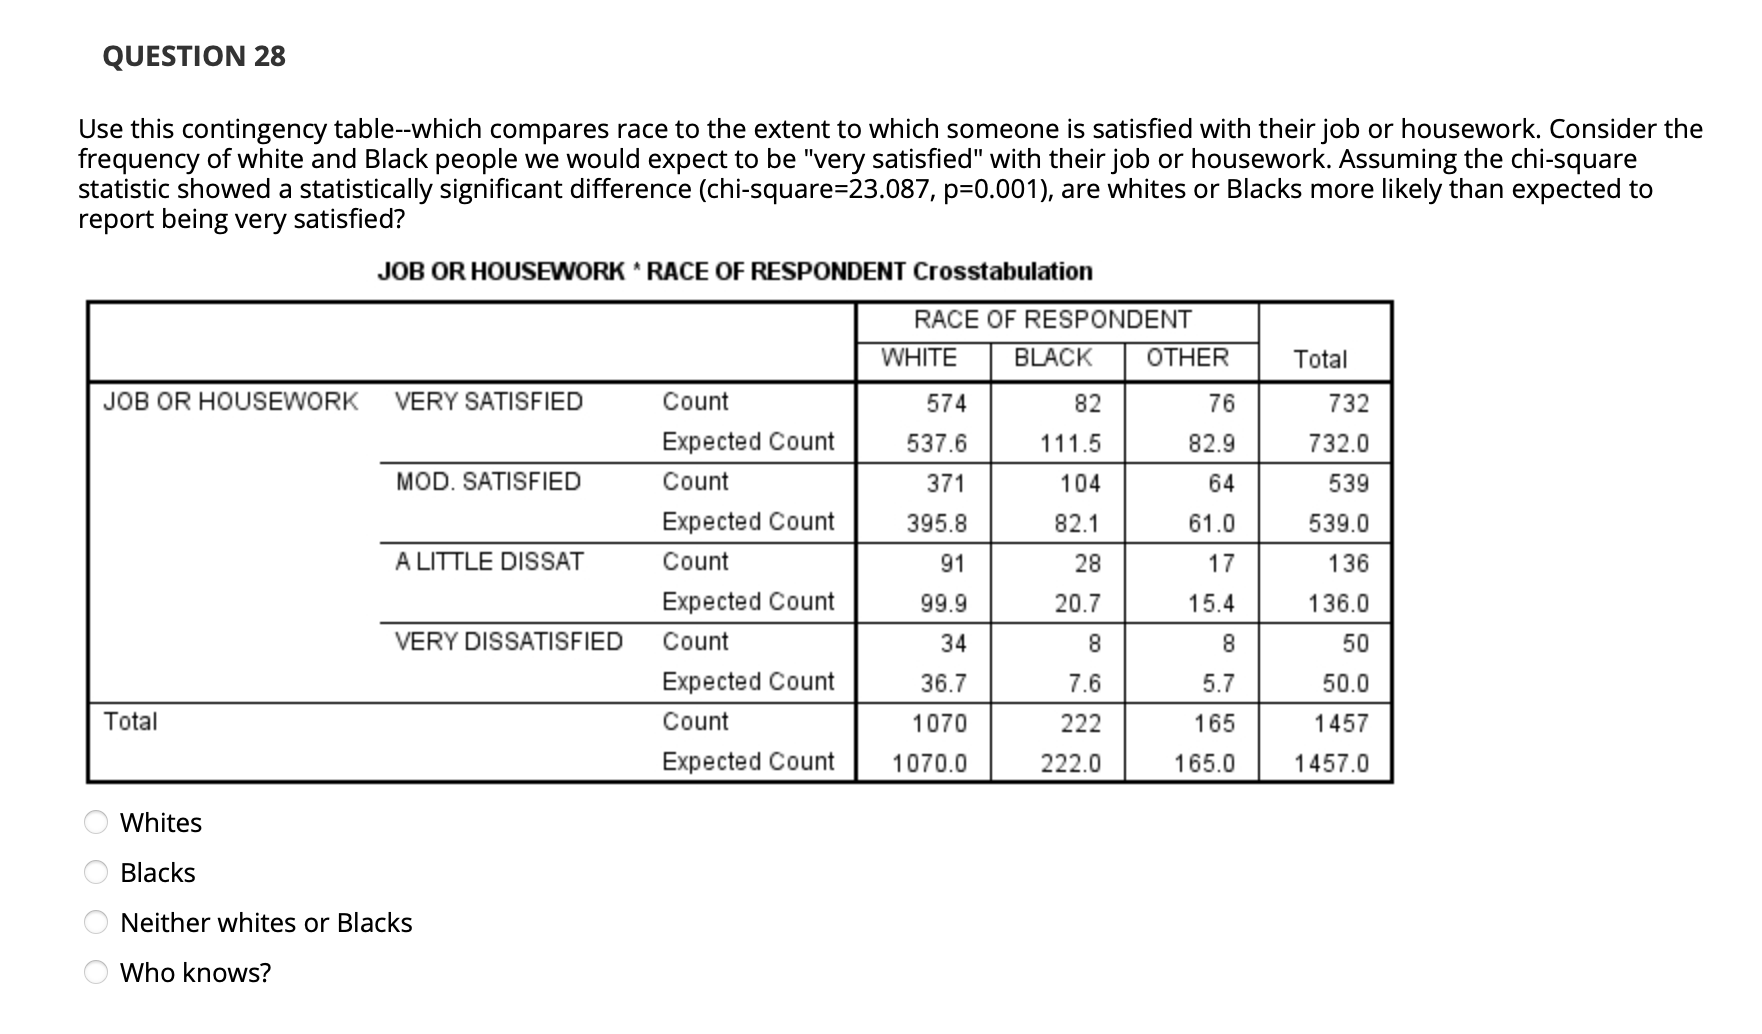


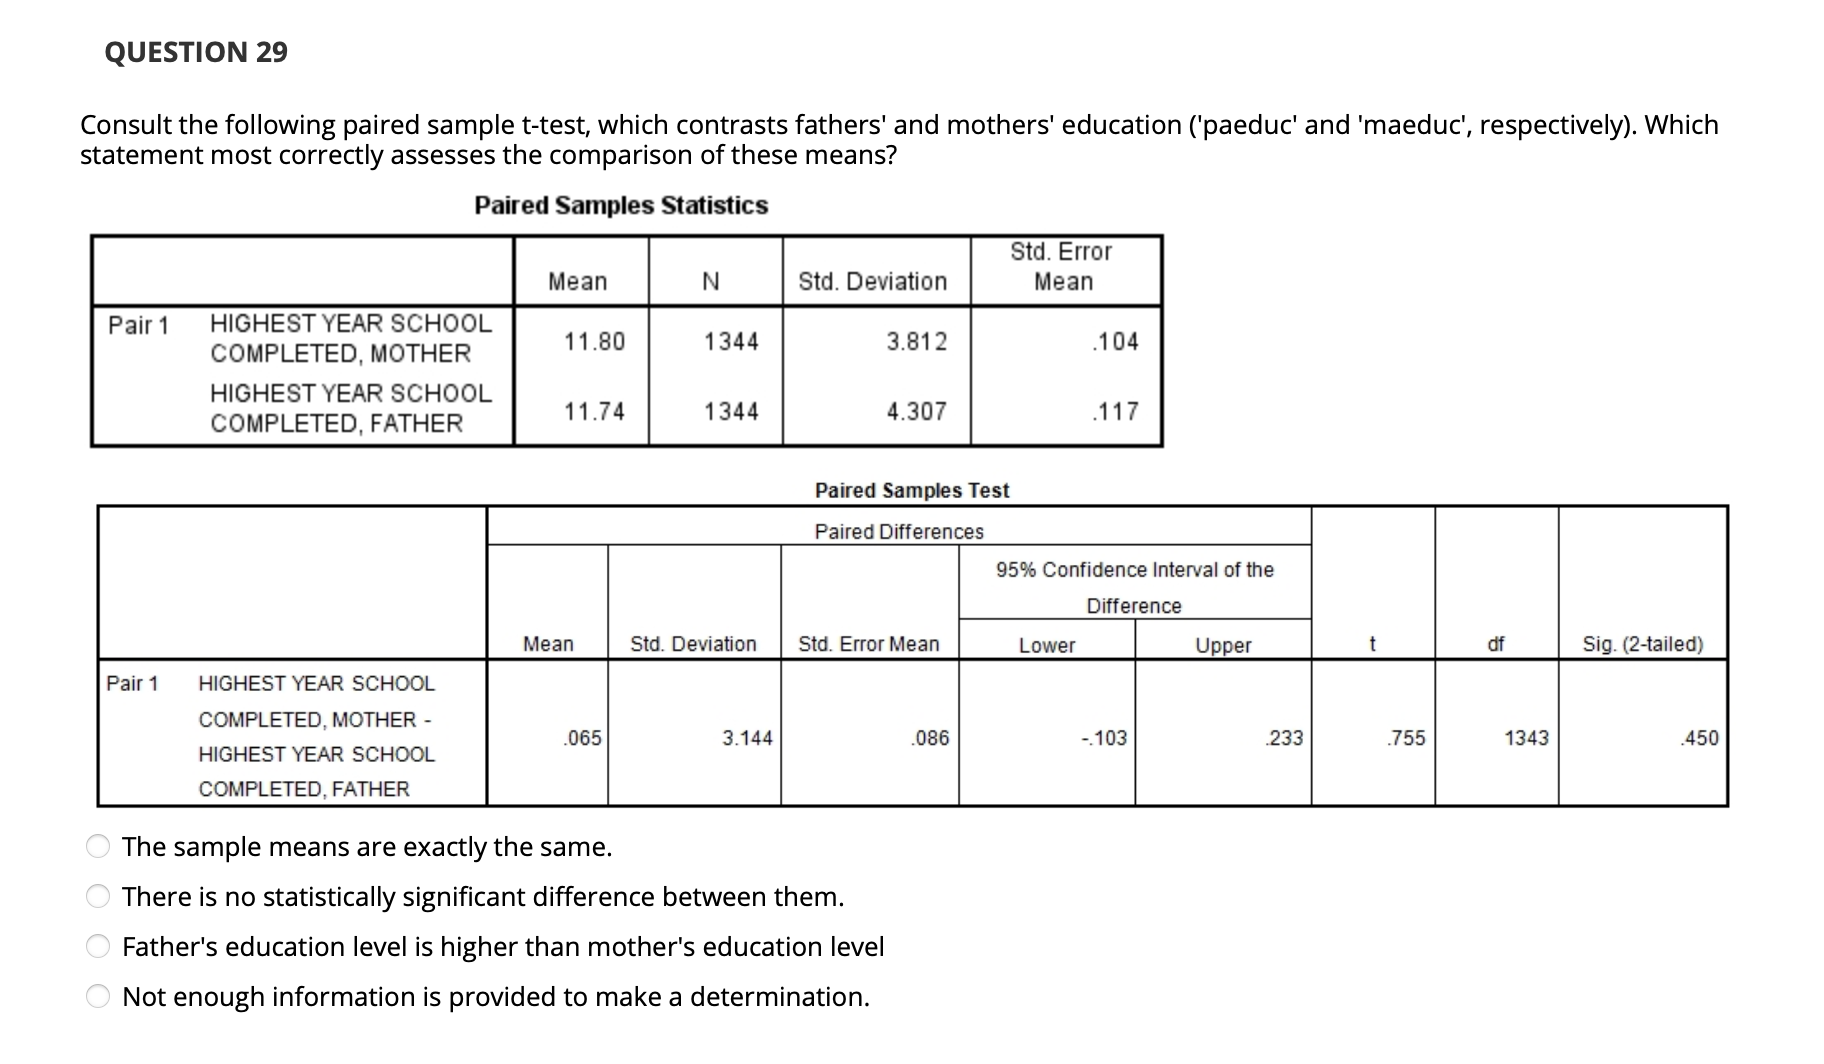
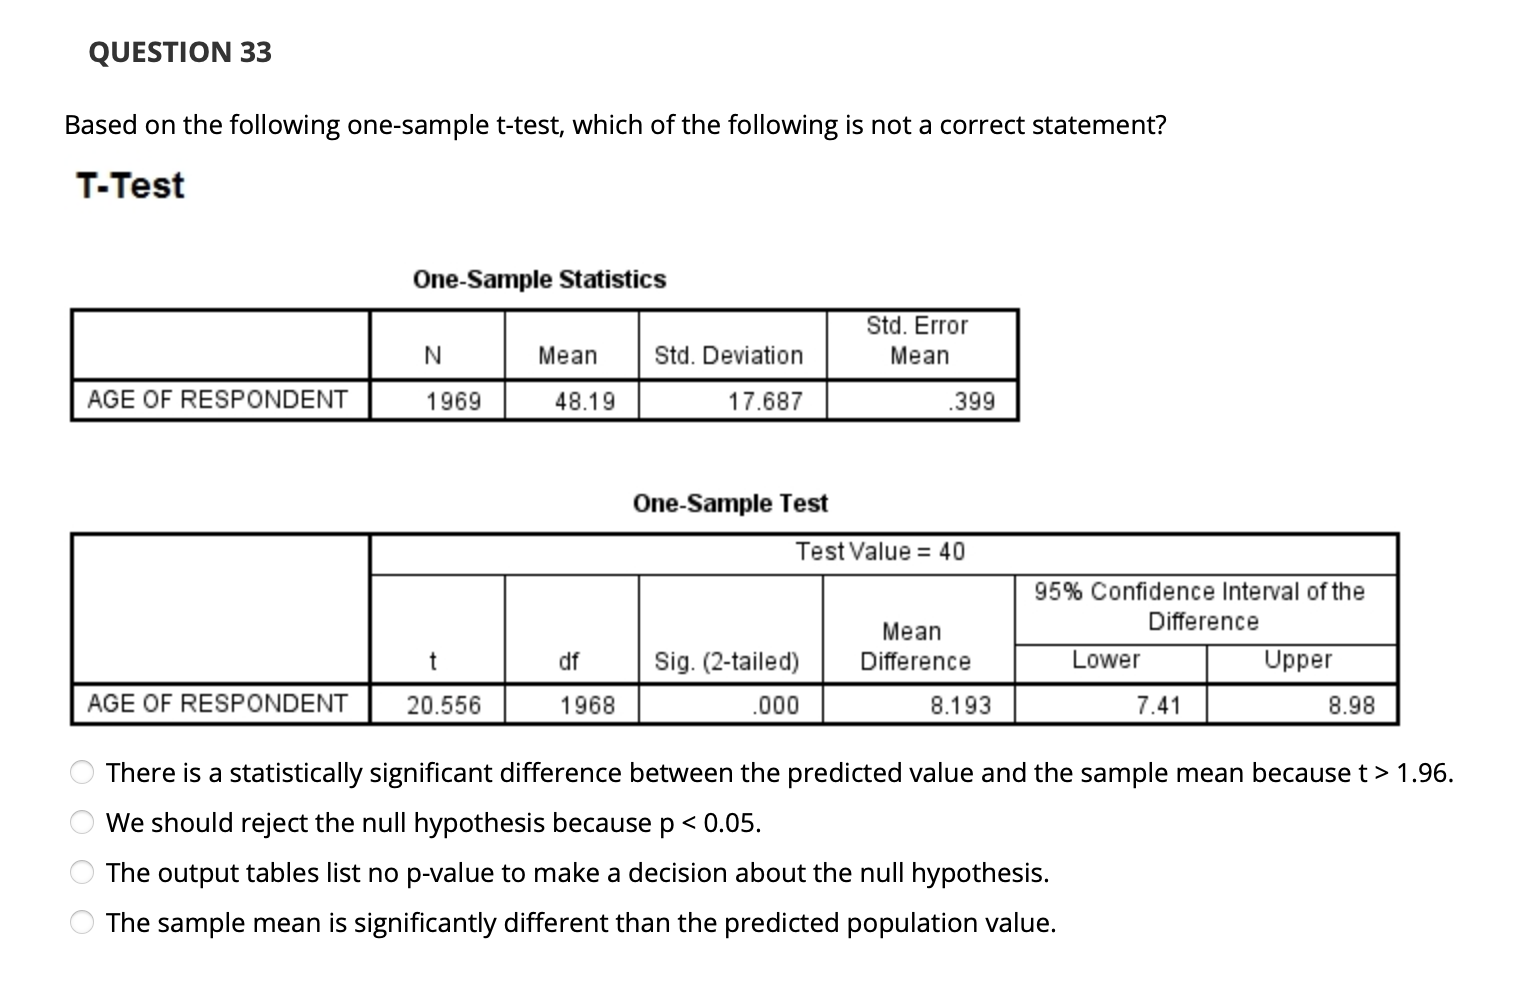
QUESTION 1 Given the following equation, what effect does the 'degree' variable have upon y y = 3 + 0.5 (age) - 2 (degree) + 1.25 (sex) O doubling O educating O positive O increasingQUESTION 3 Which test is the most appropriate to compare the mean incomes (measured in dollars per year) between women and men? O One-way ANOVA O Chi-square O Frequencies O Independent samples t-test O Pearson's correlationQUESTION 4 Inferential statistics use pvalues to indicate the likelihood that significant differences or associations exist in the population, based on the analysis of sample data. True False QUESTION 6 Which statement is not true about descriptive and inferential statistics? Descriptive statistics include frequencies, central tendency, dispersion Inferential statistics aim to draw conclusions about the population using the sample Descriptive statistics allow conclusions to be drawn about the population using the sample Inferential statistics include ttests, analysis ofvariance, Pearson's correlation, and ordinary least squares regression QUESTION 7 Use this contingency table-which compares race to the extent to which someone is satisfied with their job or housework. Based on this contingency table, a chi-square independence test would require how many degrees of freedom? JOB OR HOUSEWORK *RACE OF RESPONDENT Crosstabulation RACE OF RESPONDENT WHITE BLACK OTHER Total JOB OR HOUSEWORK VERY SATISFIED Count 574 82 76 732 Expected Count 537.6 111.5 82.9 732.0 MOD. SATISFIED Count 371 104 64 539 Expected Count 395.8 82.1 61.0 539.0 A LITTLE DISSAT Count 91 28 17 136 Expected Count 99.9 20.7 15.4 136.0 VERY DISSATISFIED Count 34 8 8 50 Expected Count 36.7 7.6 5.7 50.0 Total Count 1070 222 165 1457 Expected Count 1070.0 222.0 165.0 1457.0 O 1 O 2 0 3 0 4 6QUESTION 8 ANOVA compares two categorical variables and considers the difference between the expected and observed frequencies in each set of comparisons. True False Based on the following scatterplot and line of fit, which correlation coefficient (r) is likely for this data? O 20- O O OO O O O Births per 1000 population, 2007, ratio O O or O 15 O O O O O O O O O O oo O O O OO O 10- O O O oo Do un - 10 13 Deaths per 1000 population, 2007, ratio O -0.010 O -0.621 1.000 O 0.522QUESTION 11 What information is necessary to calculate a good nessoffit chi-square statistic? The expected and observed frequencies for each variable The sum of an observation (x) subtracted from the mean, squared and divided by the total number of cases The expected and observed frequencies for each value in the variable The degrees of freedom and p-value QUESTION 16 Du mmy-coding calculates the bivariate correlation between two variables transforms nominal data into dichotomous quantitative data places observations from a content analysis study into a coding schedule all the above QUESTION 17 Identify the Pearson's r statistic that has the strongest measure of association. 0.011 0.885 -0.901 0.232 0.'l 07 QUESTION 18 If Variablei and Variable2 have a correlation coefficient of r = 1.0 (and p 1.96. O We should reject the null hypothesis because p
Step by Step Solution
There are 3 Steps involved in it

Get step-by-step solutions from verified subject matter experts