

Question: i need help with this 9. Height vs Weight - Erroneous Data: As mentioned earlier in this chapter, sometimes an outlier can make or break
i need help with this
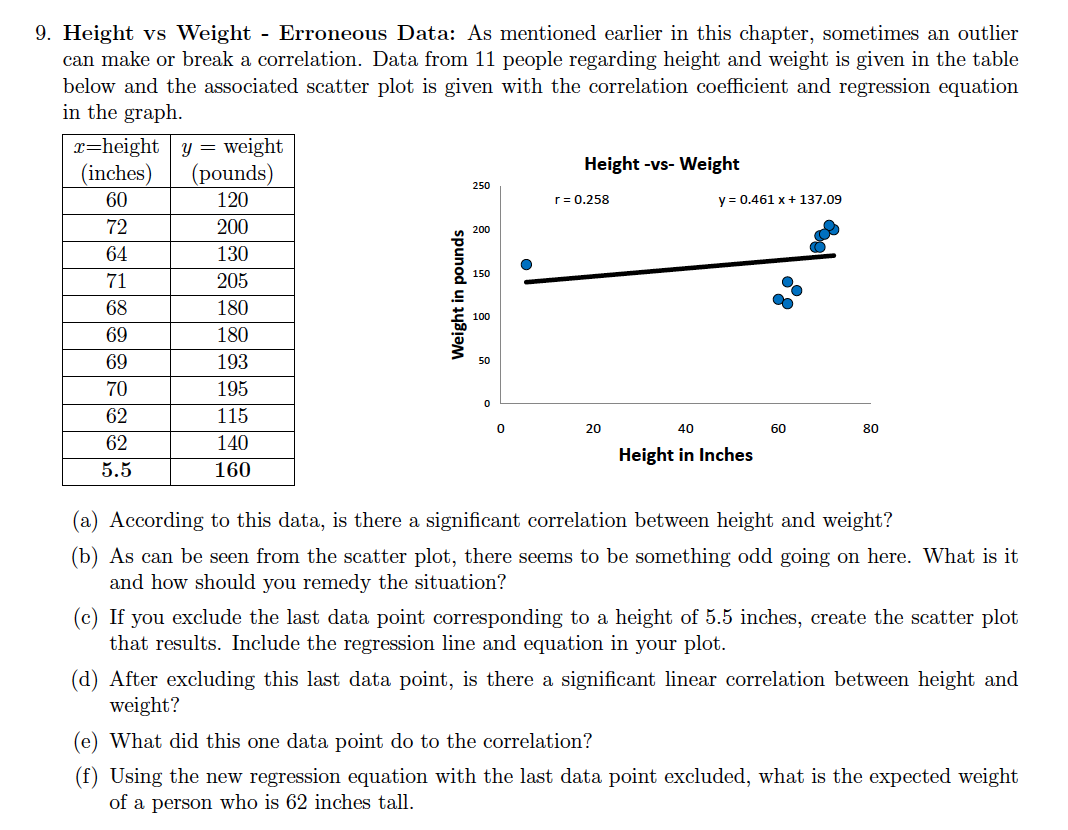
9. Height vs Weight - Erroneous Data: As mentioned earlier in this chapter, sometimes an outlier can make or break a correlation. Data from 11 people regarding height and weight is given in the table below and the associated scatter plot is given with the correlation coefficient and regression equation in the graph. r=height y = weight (inches) (pounds) Height -vs- Weight 250 60 120 r = 0.258 y = 0.461 x + 137.09 72 200 200 64 130 71 205 150 Weight in pounds 68 180 100 69 180 69 193 50 70 195 0 62 115 0 20 40 60 80 62 140 Height in Inches 5.5 160 (a) According to this data, is there a significant correlation between height and weight? (b) As can be seen from the scatter plot, there seems to be something odd going on here. What is it and how should you remedy the situation? (c) If you exclude the last data point corresponding to a height of 5.5 inches, create the scatter plot that results. Include the regression line and equation in your plot. (d) After excluding this last data point, is there a significant linear correlation between height and weight? (e) What did this one data point do to the correlation? (f) Using the new regression equation with the last data point excluded, what is the expected weight of a person who is 62 inches tall
Step by Step Solution
There are 3 Steps involved in it

Get step-by-step solutions from verified subject matter experts