

Question: I need help with this. CHAFTER 9 | HYPOTHESIS TESTING WITH ONE SAMPLE 49: Stats Lab 9.1 Hypothesis Testing of a Single Mean and Single
I need help with this.
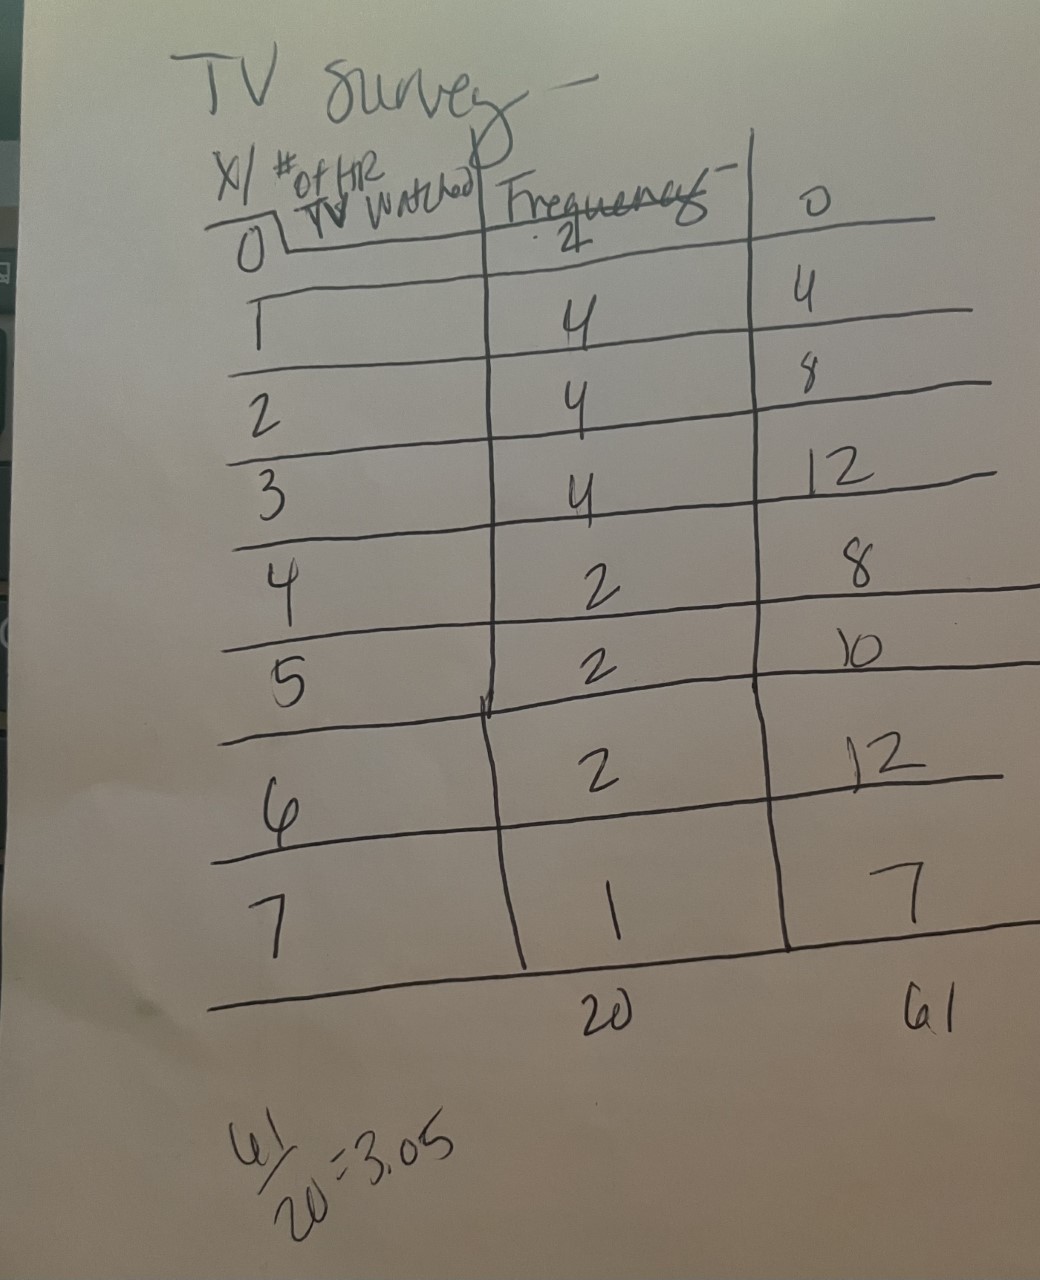
CHAFTER 9 | HYPOTHESIS TESTING WITH ONE SAMPLE 49: Stats Lab 9.1 Hypothesis Testing of a Single Mean and Single Proportion Class Time: Names: Student Learning Outcomes The student will select the appropriate distributions to use in each case. The student will conduct hypothesis tests and interpret the results. Television Survey In a recent survey, it was stated that Americans watch television on average four hours per day. Assume that o = 2. Using your class as the sample, conduct a hypothesis test to determine if the average for students at your school is lower. 1. Ho: 2. Ha 3. In words, define the random variable. The distribution to use for the test is 5. Determine the test statistic using your data. 6. Draw a graph and label it appropriately. Shade the actual level of significance. a. Graph: Figure 9.21 b. Determine the p-value. 7. Do you or do you not reject the null hypothesis? Why? B. Write a clear conclusion using a complete sentence. Language Survey About 42 3%% of Californians and 19.696 of all Americans over age five speak a language other than English at home. Using your class as the sample, conduct a hypothesis test to determine if the percent of the students at your school who speak a language other than English at home is different from 42 396. 1. Ho: 2.\f
Step by Step Solution
There are 3 Steps involved in it

Get step-by-step solutions from verified subject matter experts