

Question: I need help with this chart. A Stacked Columns Chart of the Number of Transactions per Day of the Week with product Categories stacked on
I need help with this chart.
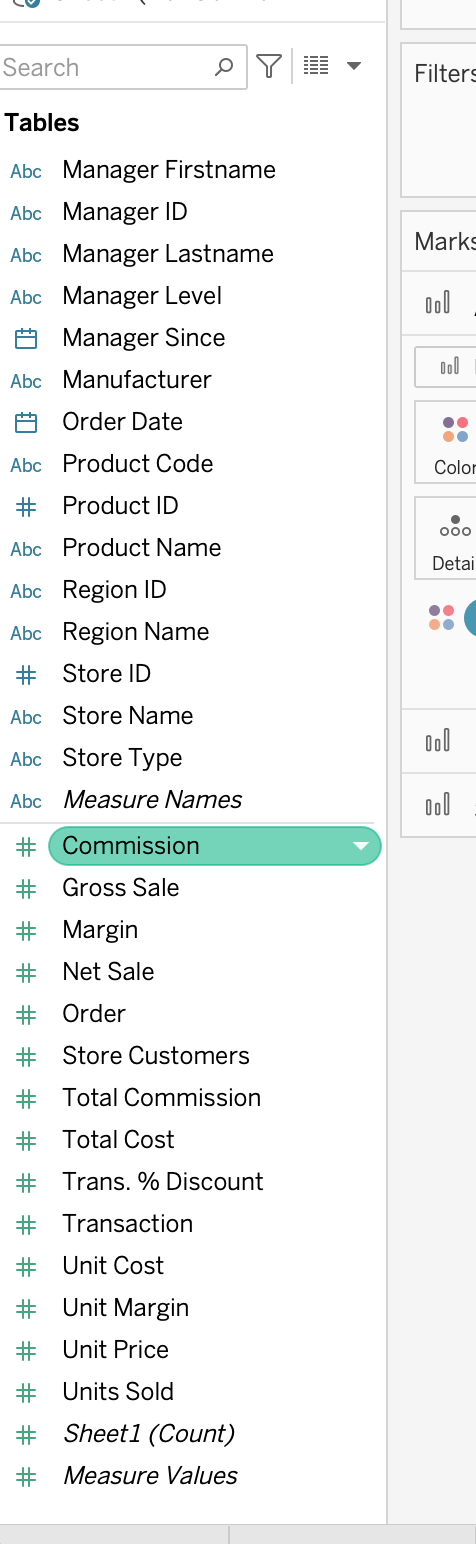
A Stacked Columns Chart of the Number of Transactions per Day of the Week with product Categories stacked on each day's bar.
Tables
Abc Manager Firstname
Abc Manager ID
Abc Manager Lastname
Abc Manager Level
Manager Since
Abc Manufacturer
Order Date
Abc Product Code
# Product ID
Abc Product Name
Abc Region ID
Abc Region Name
# Store ID
Abc Store Name
Abc Store Type
Abc Measure Names
#
Commission
# Gross Sale
# Margin
# Net Sale
# Order
# Store Customers
# Total Commission
# Total Cost
# Trans. Discount
# Transaction
# Unit Cost
# Unit Margin
# Unit Price
# Units Sold
# SheetCount
# Measure Values
Step by Step Solution
There are 3 Steps involved in it
1 Expert Approved Answer
Step: 1 Unlock

Question Has Been Solved by an Expert!
Get step-by-step solutions from verified subject matter experts
Step: 2 Unlock
Step: 3 Unlock