

Question: I need help with this exercise/graph. I am sending you attached photo. The exercise is in the picture that I upload. The graph shows the
I need help with this exercise/graph. I am sending you attached photo. The exercise is in the picture that I upload.
The graph shows the combined benefits/deficit of a company for six consecutive years
Find the difference between the year 4 combined amount and the year 6 combined amount.
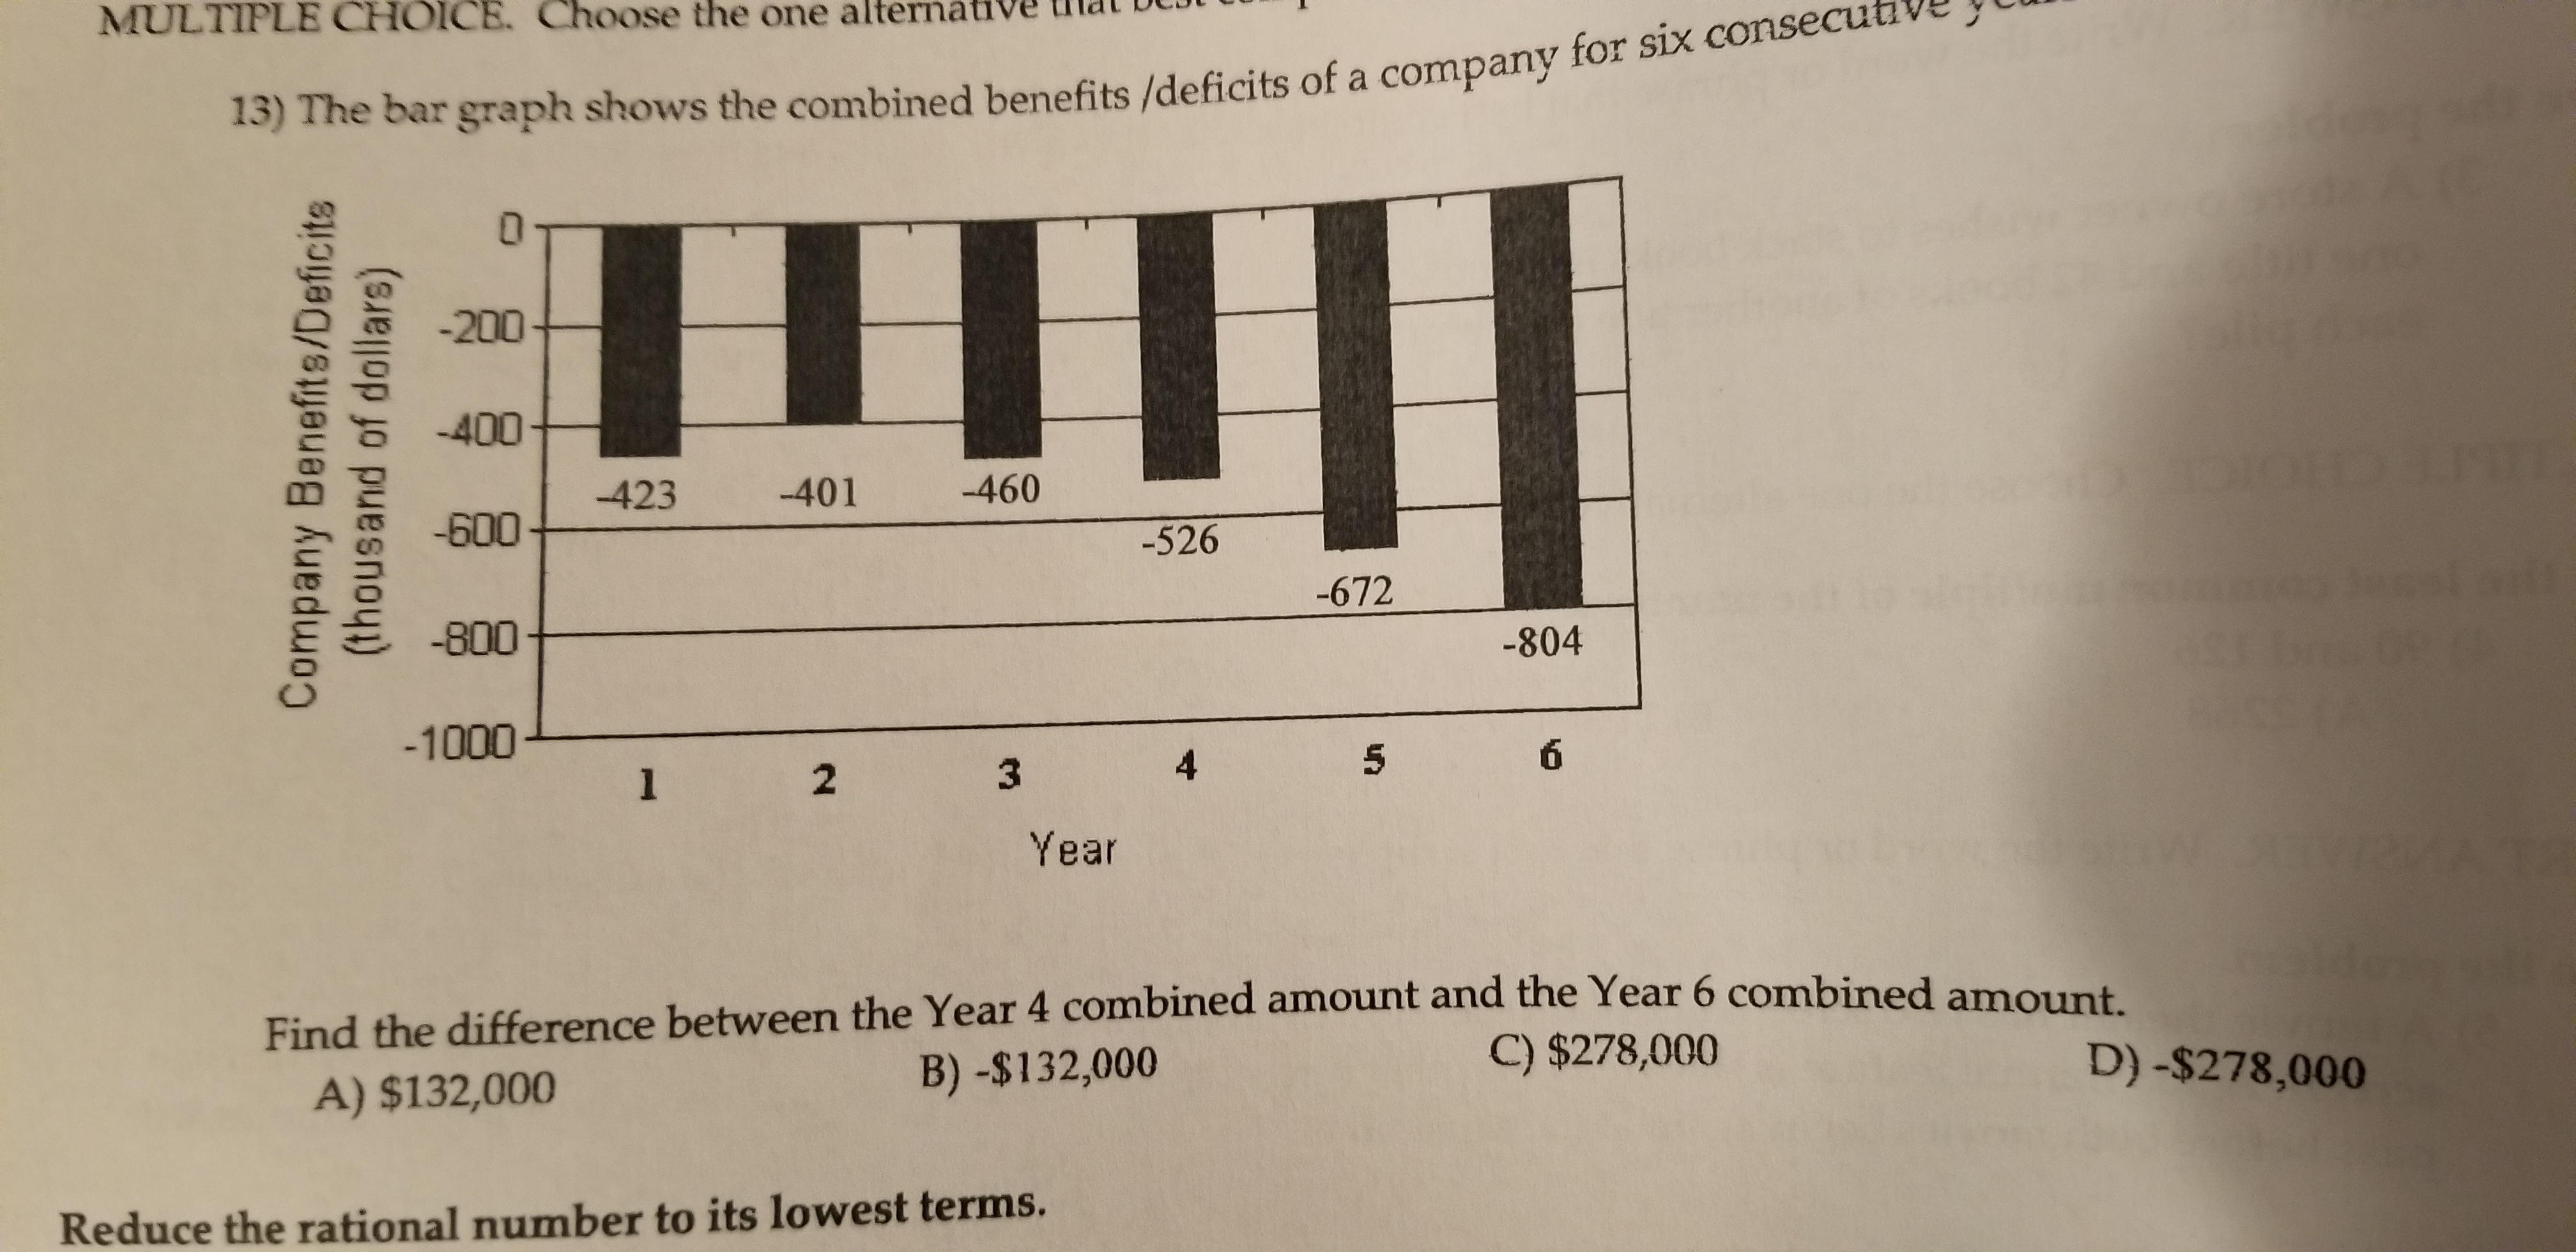
MULTIPLE CHOICE. Choose the one alter 13) The bar graph shows the combined benefits /deficits of a company for six consecutive y Company Benefits/Deficits (thousand of dollars) -200- -400 -600 -423 -401 -460 -526 -800 -672 -804 -1000 N Year Find the difference between the Year 4 combined amount and the Year 6 combined amount. A) $132,000 B) -$132,000 C) $278,000 D) -$278,000 Reduce the rational number to its lowest terms
Step by Step Solution
There are 3 Steps involved in it

Get step-by-step solutions from verified subject matter experts