

Question: I need help with this graph. This is what I plotted but it is wrong. I think I may be missing points but I'm not
I need help with this graph. This is what I plotted but it is wrong. I think I may be missing points but I'm not 100% sure.
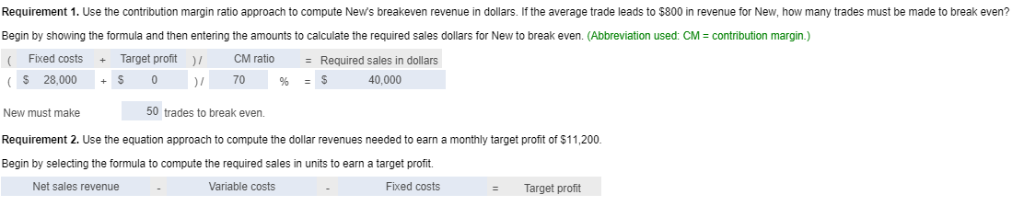
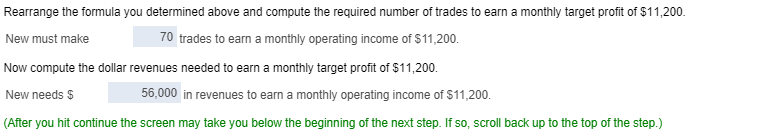
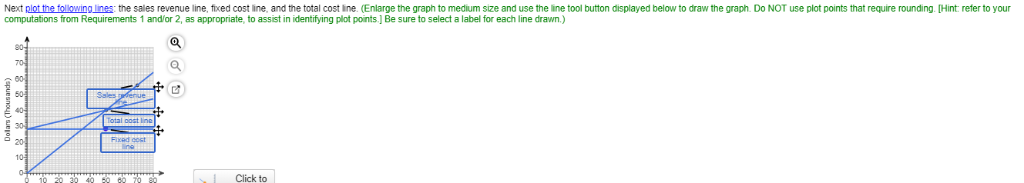
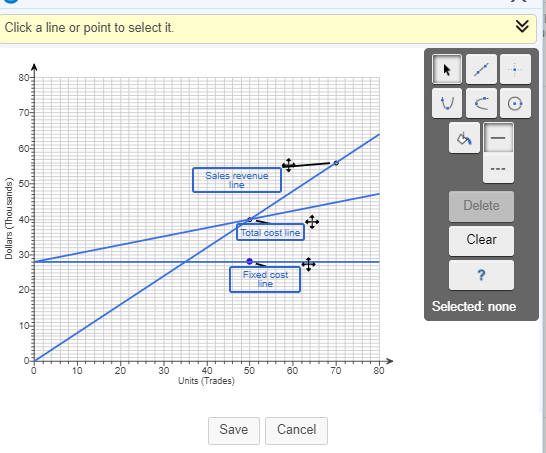
made to break even? Requirement 1. Use the contribution margin ratio approach to compute New's breakeven revenue in dollars. If the average trade leads to $800 in revenue for New, how many trades must Begin by showing the formula and then entering the amounts calculate the required sales dollars for New break even. (Abbreviation used: CM = contribution margin.) Target profit Fixed costs CM ratio = Required sales in dollars S 28,000 = $ 40,000 S 70 50 trades New must make break even. Requirement 2. Use the equation approach to compute the dollar revenues needed to earn a monthly target profit of $11,200. Begin by selecting the formula to compute the required sales in units to earn a target profit. Net sales revenue Variable costs Fixed costs Target profit Rearrange the formula you determined above and compute the required number of trades to earn a monthly target profit of $11,200. 70 trades to earn a monthly operating income of $11,200. New must make Now compute the dollar revenues needed to earn a monthly target profit of $11,200. 56,000 in revenues to earn a monthly operating income of $11,200. New needs $ (After you hit continue the screen may take you below the beginning of the next step. If so, scroll back up to the top of the step.) tool button displayed below to draw the graph. Do NOT use plot points that require rounding. [Hint refer to your computations from Requirements 1 and/or 2, as appropriate, to assist in identifving plot points.1 Be sure to select a label for each line drawn.) Sales gfenue Total oost ine Fixad dost 10 Click to Click a line or point to select it 80- 70- 60- Sales revenue line 50- Delete 40- Total cost line Clear Foxed cost ine 20- Selected: none 10- 40 30 Units (Trades) 10 20 60 70 Cancel Save 50 (spues nou) selo
Step by Step Solution
There are 3 Steps involved in it

Get step-by-step solutions from verified subject matter experts