

Question: I need help with this l ne orrecror or me MBA program at baiterglne unrversrty wants to develop a procedure to determine which applicants to
I need help with this
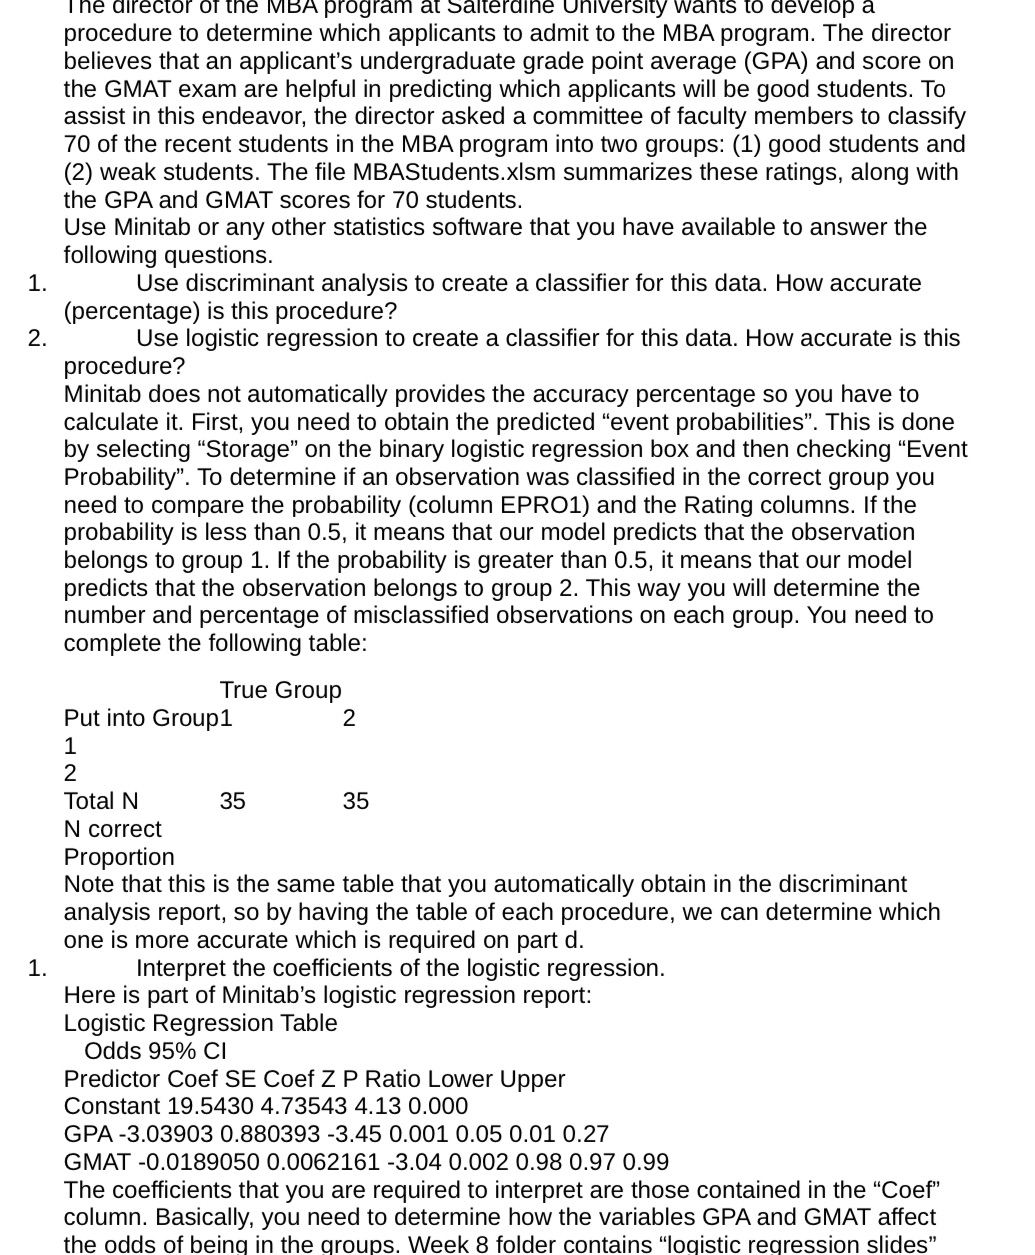
l ne orrecror or me MBA program at baiterglne unrversrty wants to develop a procedure to determine which applicants to admit to the MBA program. The director believes that an applicant's undergraduate grade point average (GPA) and score on the GMAT exam are helpful in predicting which applicants will be good students. To assist in this endeavor. the director asked a committee of faculty members to classify 70 of the recent students in the MBA program into two groups: (1) good students and (2) weak students. The file MBAStudents.xlsm summarizes these ratings, along with the GPA and GMAT scores for 70 students. Use Minitab or any other statistics software that you have available to answer the following questions. Use discriminant analysis to create a classier for this data. How accurate (percentage) is this procedure? Use logistic regression to create a classifier for this data. How accurate is this procedure? Minitab does not automatically provides the accuracy percentage so you have to calculate it. First. you need to obtain the predicted "event probabilities". This is done by selecting \"Storage" on the binary logistic regression box and then checking "Event Probability". To determine if an observation was classied in the correct group you need to compare the probability (column EPROl) and the Rating columns. If the probability is less than 0.5. it means that our model predicts that the observation belongs to group 1. If the probability is greater than 0.5. it means that our model predicts that the observation belongs to group 2. This way you will determine the number and percentage of misclassified observations on each group. You need to complete the following table: True Group Put into Groupl 2 1 2 Total N 35 35 N correct Proportion Note that this is the same table that you automatically obtain in the discriminant analysis report. so by having the table of each procedure. we can determine which one is more accurate which is required on part d. Interpret the coefficients of the logistic regression. Here is part of Minitab's logistic regression report: Logistic Regression Table Odds 95% Cl Predictor Coef SE Coef Z P Ratio Lower Upper Constant 19.5430 4.73543 4.13 0.000 GPA -3.03903 0.880393 -3.45 0.001 0.05 0.01 0.27 GMAT -0.0189050 0.0062161 -3.04 0.002 0.98 0.97 0.99 The coefficients that you are required to interpret are those contained in the \"Coef\" column. Basically. you need to determine how the variables GPA and GMAT affect the odds of being in the groups. Week 8 folder contains "logistic regression slides"
Step by Step Solution
There are 3 Steps involved in it

Get step-by-step solutions from verified subject matter experts