

Question: I need help with this multiple part question. (3) The proportion of a population after t years is modeled by the updating function 29? -
I need help with this multiple part question.
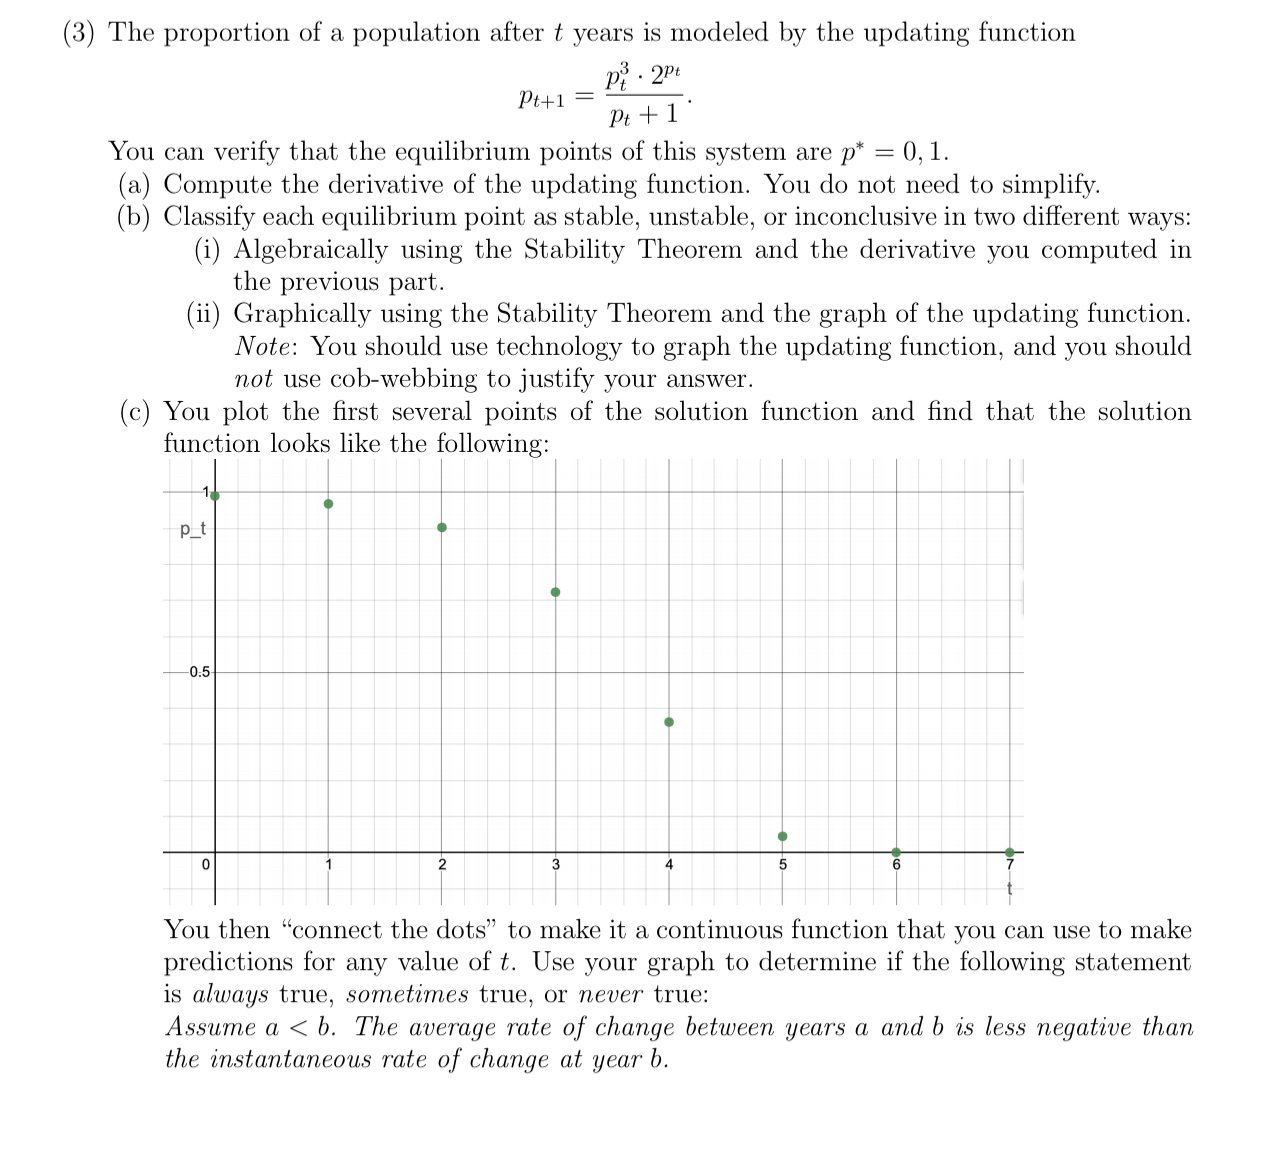
(3) The proportion of a population after t years is modeled by the updating function 29? - 2?" pg + 1 ' You can verify that the equilibrium points of this system are 30* = 0, 1. (a) Compute the derivative of the updating function. You do not need to simplify. (b) Classify each equilibrium point as stable, unstable, or inconclusive in two different ways: (i) Algebraically using the Stability Theorem and the derivative you computed in the previous part. (ii) Graphically using the Stability Theorem and the graph of the updating function. Note: You should use technology to graph the updating function, and you should not use cobwebbing to justify your answer. (c) You plot the rst several points of the solution function and find that the solution function looks like the following: Pt+1 = 0:5 You then \"c0nnect the dots\" to make it a continuous function that you can use to make predictions for any value of t. Use your graph to determine if the following statement is always true, sometimes true, or never true: Assume a
Step by Step Solution
There are 3 Steps involved in it

Get step-by-step solutions from verified subject matter experts