

Question: I need help with this. Part Two - FRQ Q13. 12 points Directions: Show all your work. Indicate clearly the methods you use, because you
I need help with this.
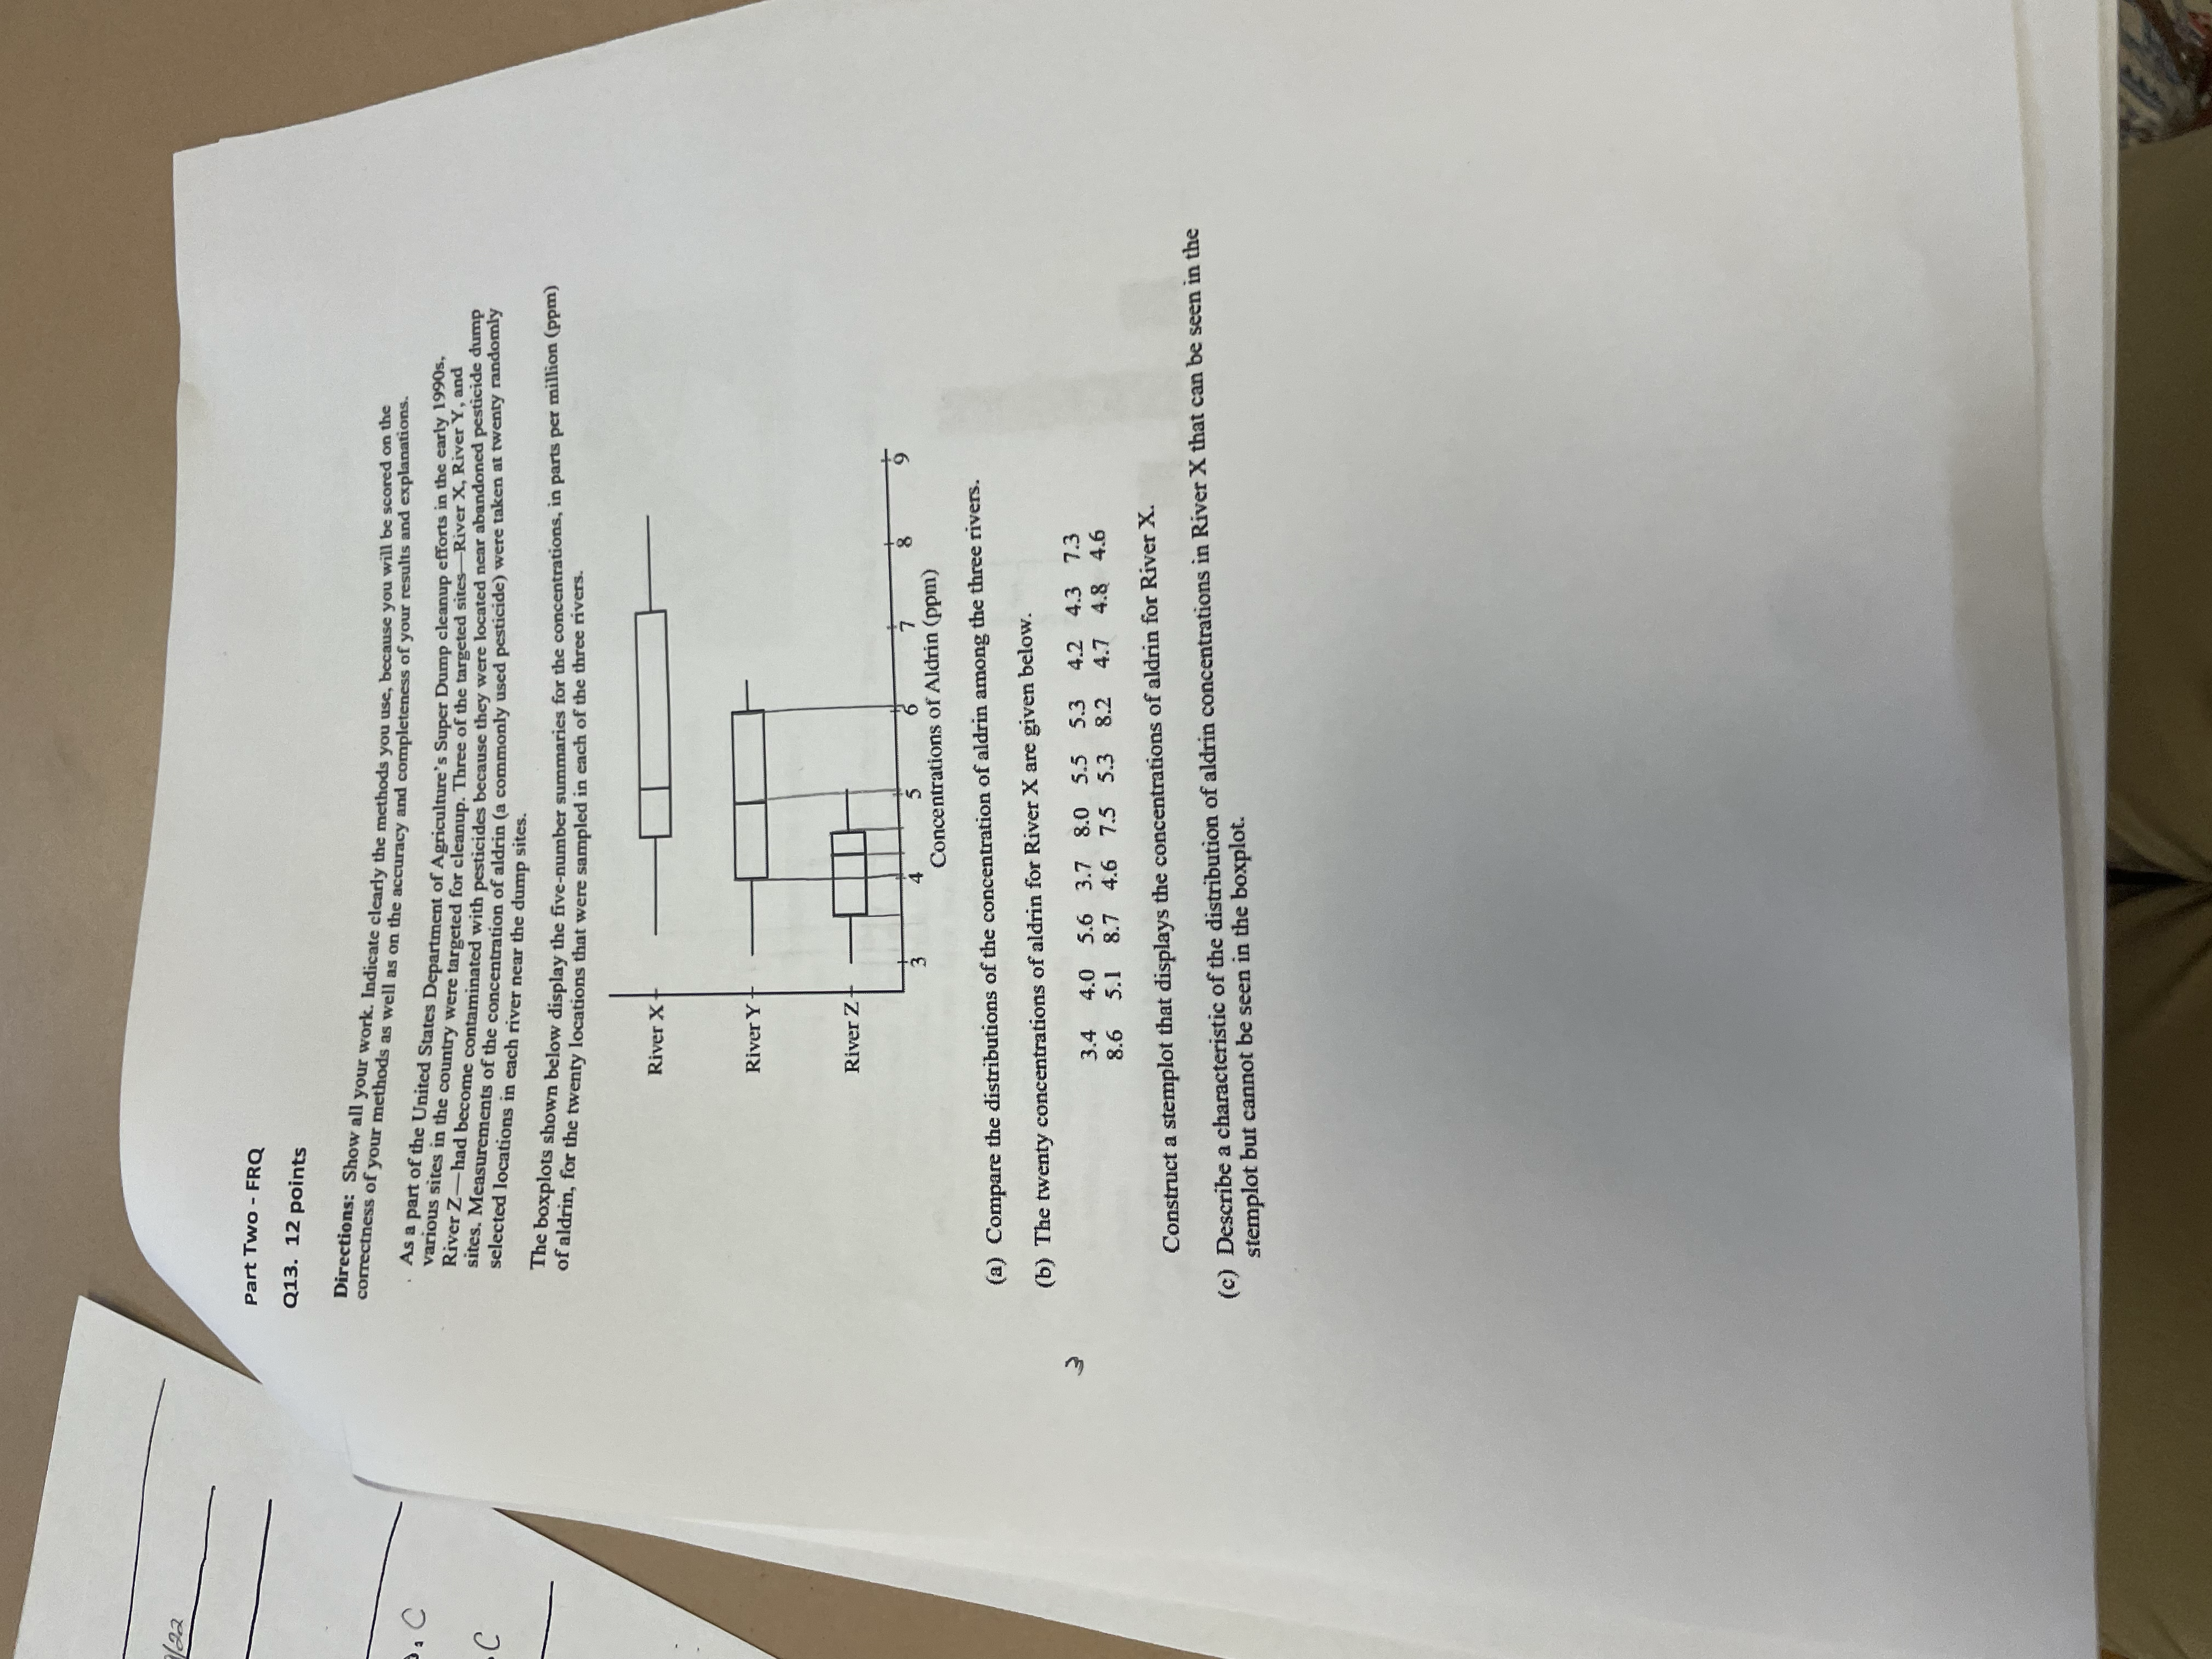
Part Two - FRQ Q13. 12 points Directions: Show all your work. Indicate clearly the methods you use, because you will be scored on the correctness of your methods as well as on the accuracy and completeness of your results and explanations As a part of the United States Department of Agriculture's Super Dump cleanup efforts in the early 1990s, various sites in the country were targeted for cleanup. Three of the targeted sites-River X, River Y, and River Z-had become contaminated with pesticides because they were located near abandoned pesticide dump sites. Measurements of the concentration of aldrin (a commonly used pesticide) were taken at twenty randomly selected locations in each river near the dump sites. The boxplots shown below display the five-number summaries for the concentrations, in parts per million (ppm) of aldrin, for the twenty locations that were sampled in each of the three rivers. River X River Y River Z 6 7 8 Concentrations of Aldrin (ppm) (a) Compare the distributions of the concentration of aldrin among the three rivers. (b) The twenty concentrations of aldrin for River X are given below. m 3.4 4.0 5.6 3.7 8.0 5.5 3 4.2 4.3 7.3 8.6 5.1 8.7 4.6 7.5 5.3 8.2 4.7 4.8 4.6 Construct a stemplot that displays the concentrations of aldrin for River X. (c) Describe a characteristic of the distribution of aldrin concentrations in River X that can be seen in the stemplot but cannot be seen in the boxplot
Step by Step Solution
There are 3 Steps involved in it

Get step-by-step solutions from verified subject matter experts