

Question: I need help with this problem, can you please show me step by step? 20. (20 points) In 1929, Edwin Hubble investigated the relationship between
I need help with this problem, can you please show me step by step?
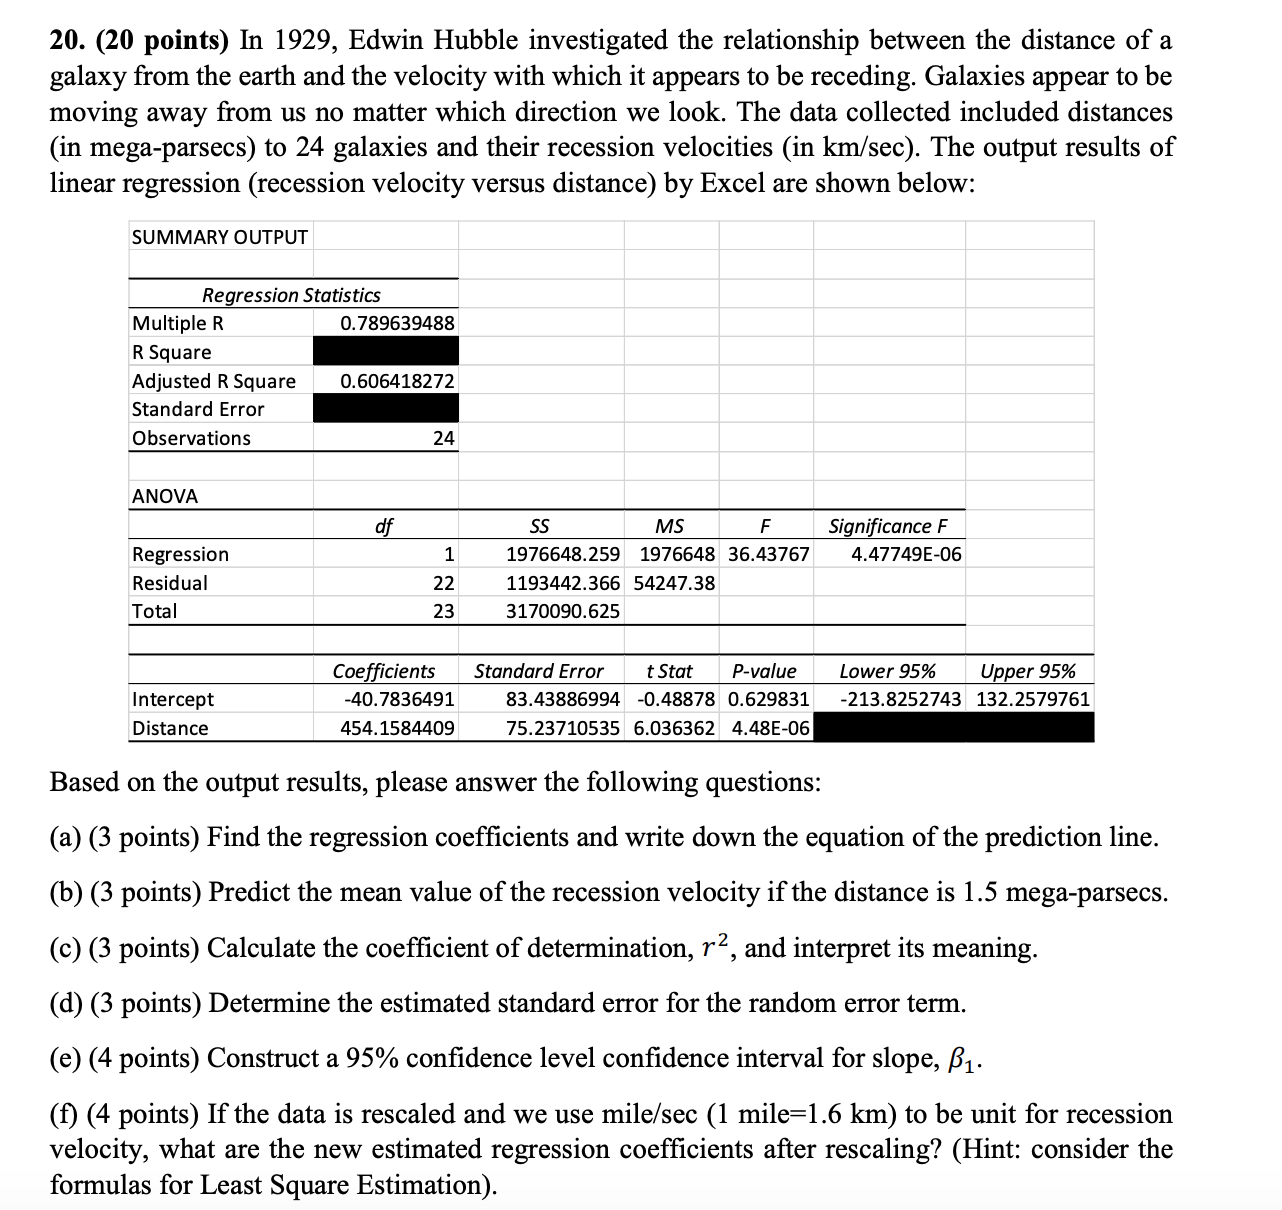
20. (20 points) In 1929, Edwin Hubble investigated the relationship between the distance of a galaxy from the earth and the velocity with which it appears to be receding. Galaxies appear to be moving away from us no matter which direction we look. The data collected included distances (in mega-parsecs) to 24 galaxies and their recession velocities (in km/sec). The output results of linear regression (recession velocity versus distance) by Excel are shown below: SUMMARY OUTPUT Regression Statistics Multiple R .789639488 R Square Adjusted R Square 0.606418272 Standard Error Observations 24 ANOVA df SS MS F Significance F Regression 1 1976648.259 1976648 36.43767 4.47749E-06 Residual 22 1193442.366 54247.38 Total 23 3170090.6 Coefficients Standard Error t Stat P-value Lower 95% Upper 95% Intercept 40.7836491 83.43886994 -0.48878 0.629831 -213.8252743 132.2579761 Distance 454.1584409 75.23710535 6.036362 4.48E-06 Based on the output results, please answer the following questions: (a) (3 points) Find the regression coefficients and write down the equation of the prediction line. (b) (3 points) Predict the mean value of the recession velocity if the distance is 1.5 mega-parsecs. (c) (3 points) Calculate the coefficient of determination, r2, and interpret its meaning. (d) (3 points) Determine the estimated standard error for the random error term. (e) (4 points) Construct a 95% confidence level confidence interval for slope, B1. (f) (4 points) If the data is rescaled and we use mile/sec (1 mile=1.6 km) to be unit for recession velocity, what are the new estimated regression coefficients after rescaling? (Hint: consider the formulas for Least Square Estimation)
Step by Step Solution
There are 3 Steps involved in it

Get step-by-step solutions from verified subject matter experts