

Question: I need help with this project. I need you to show me on how to do this project correctly. Just follow the steps and make
I need help with this project. I need you to show me on how to do this project correctly. Just follow the steps and make sure that you save the file as an excel file. Thanks.
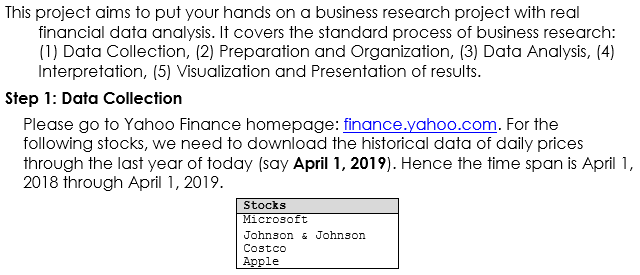
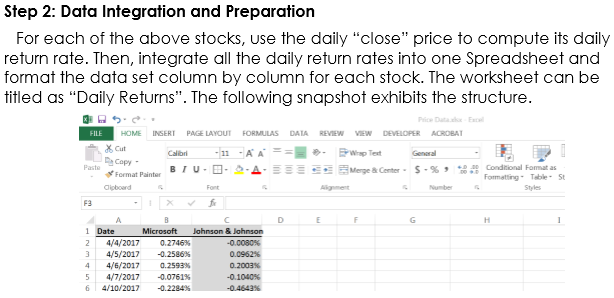
This project aims to put your hands on a business research project with redal financial data analysis. It covers the standard process of business research: (1) Data Collection, (2) Preparation and Organization, (3) Data Analysis, (4) Interpretation, (5) Visualization and Presentation of results. Step 1: Data Collection Please go to Yahoo Finance homepage: finance.yahoo.com. For the following stocks, we need to download the historical data of daily prices through the last year of today (say April 1, 2019). Hence the time span is April 1, 2018 through April 1, 2019. Stocks Microsoft Johnson &Johnson Costco Apple Step 2: Data Integration and Preparation For each of the above stocks, use the daily "close" price to compute its daily return rate. Then, integrate all the daily return rates into one Spreadsheet and format the data set column by column for each stock. The worksheet can be titled as "Daily Returns". The following snapshot exhibits the structure HOME INSERT PAGE LAYOUT FORMULAS DAIA REVIEW VEN DEVELOPER ACROBAT % Cut Capy Format Paint ipboard B 1 ub-2.. -Merge & Center. S.% ,conditional Fame as Formatting-TableSt Styles F3 Date 4/4/2017 0.2746% 314/5/2017-0.25865% 4/6/2017 0.2593% 4/7/2017-0.0761% 6 4/10/2017-0.2284% -0 0080% 0.0962% 0.2003% -0 1040% Step 3: Data Analysis Compute descriptive statistics for each stock and show their average return rates and standard deviation values. Comment on your results. Which stock are the most volatile in terms of their standard deviations? Step 4: Interpretation of Portfolio Now consider a portfolio consisting u, of the first stock, w, of the second stock, w, of the third stock and w, of the fourth stock, where w, + w2 + w, w1. For the selection of each 0S w, s1, show the expected return and standard deviation of the portfolio. Step 5: Visualization and Presentation of data For each level of expected return of the portfolio, from 0.05%, 0.06%, 0.07% 0.2%, using solver to find the optimal portfolio, and the corresponding standard deviation. Summarize your optimal portfolio in a table. Then visualize the efficient frontier with a graph, similar to Figure 1. Comment on your graphical presentation. What is your financial advice for investment? This project aims to put your hands on a business research project with redal financial data analysis. It covers the standard process of business research: (1) Data Collection, (2) Preparation and Organization, (3) Data Analysis, (4) Interpretation, (5) Visualization and Presentation of results. Step 1: Data Collection Please go to Yahoo Finance homepage: finance.yahoo.com. For the following stocks, we need to download the historical data of daily prices through the last year of today (say April 1, 2019). Hence the time span is April 1, 2018 through April 1, 2019. Stocks Microsoft Johnson &Johnson Costco Apple Step 2: Data Integration and Preparation For each of the above stocks, use the daily "close" price to compute its daily return rate. Then, integrate all the daily return rates into one Spreadsheet and format the data set column by column for each stock. The worksheet can be titled as "Daily Returns". The following snapshot exhibits the structure HOME INSERT PAGE LAYOUT FORMULAS DAIA REVIEW VEN DEVELOPER ACROBAT % Cut Capy Format Paint ipboard B 1 ub-2.. -Merge & Center. S.% ,conditional Fame as Formatting-TableSt Styles F3 Date 4/4/2017 0.2746% 314/5/2017-0.25865% 4/6/2017 0.2593% 4/7/2017-0.0761% 6 4/10/2017-0.2284% -0 0080% 0.0962% 0.2003% -0 1040% Step 3: Data Analysis Compute descriptive statistics for each stock and show their average return rates and standard deviation values. Comment on your results. Which stock are the most volatile in terms of their standard deviations? Step 4: Interpretation of Portfolio Now consider a portfolio consisting u, of the first stock, w, of the second stock, w, of the third stock and w, of the fourth stock, where w, + w2 + w, w1. For the selection of each 0S w, s1, show the expected return and standard deviation of the portfolio. Step 5: Visualization and Presentation of data For each level of expected return of the portfolio, from 0.05%, 0.06%, 0.07% 0.2%, using solver to find the optimal portfolio, and the corresponding standard deviation. Summarize your optimal portfolio in a table. Then visualize the efficient frontier with a graph, similar to Figure 1. Comment on your graphical presentation. What is your financial advice for investment
Step by Step Solution
There are 3 Steps involved in it

Get step-by-step solutions from verified subject matter experts