

Question: I need help with this project, my topic will be overweight and obesity , so I wanted to know if you could help me with
I need help with this project, my topic will be overweight and obesity, so I wanted to know if you could help me with this project and explain to me with clear examples of what I have to do because I don't know where to start; please help me.
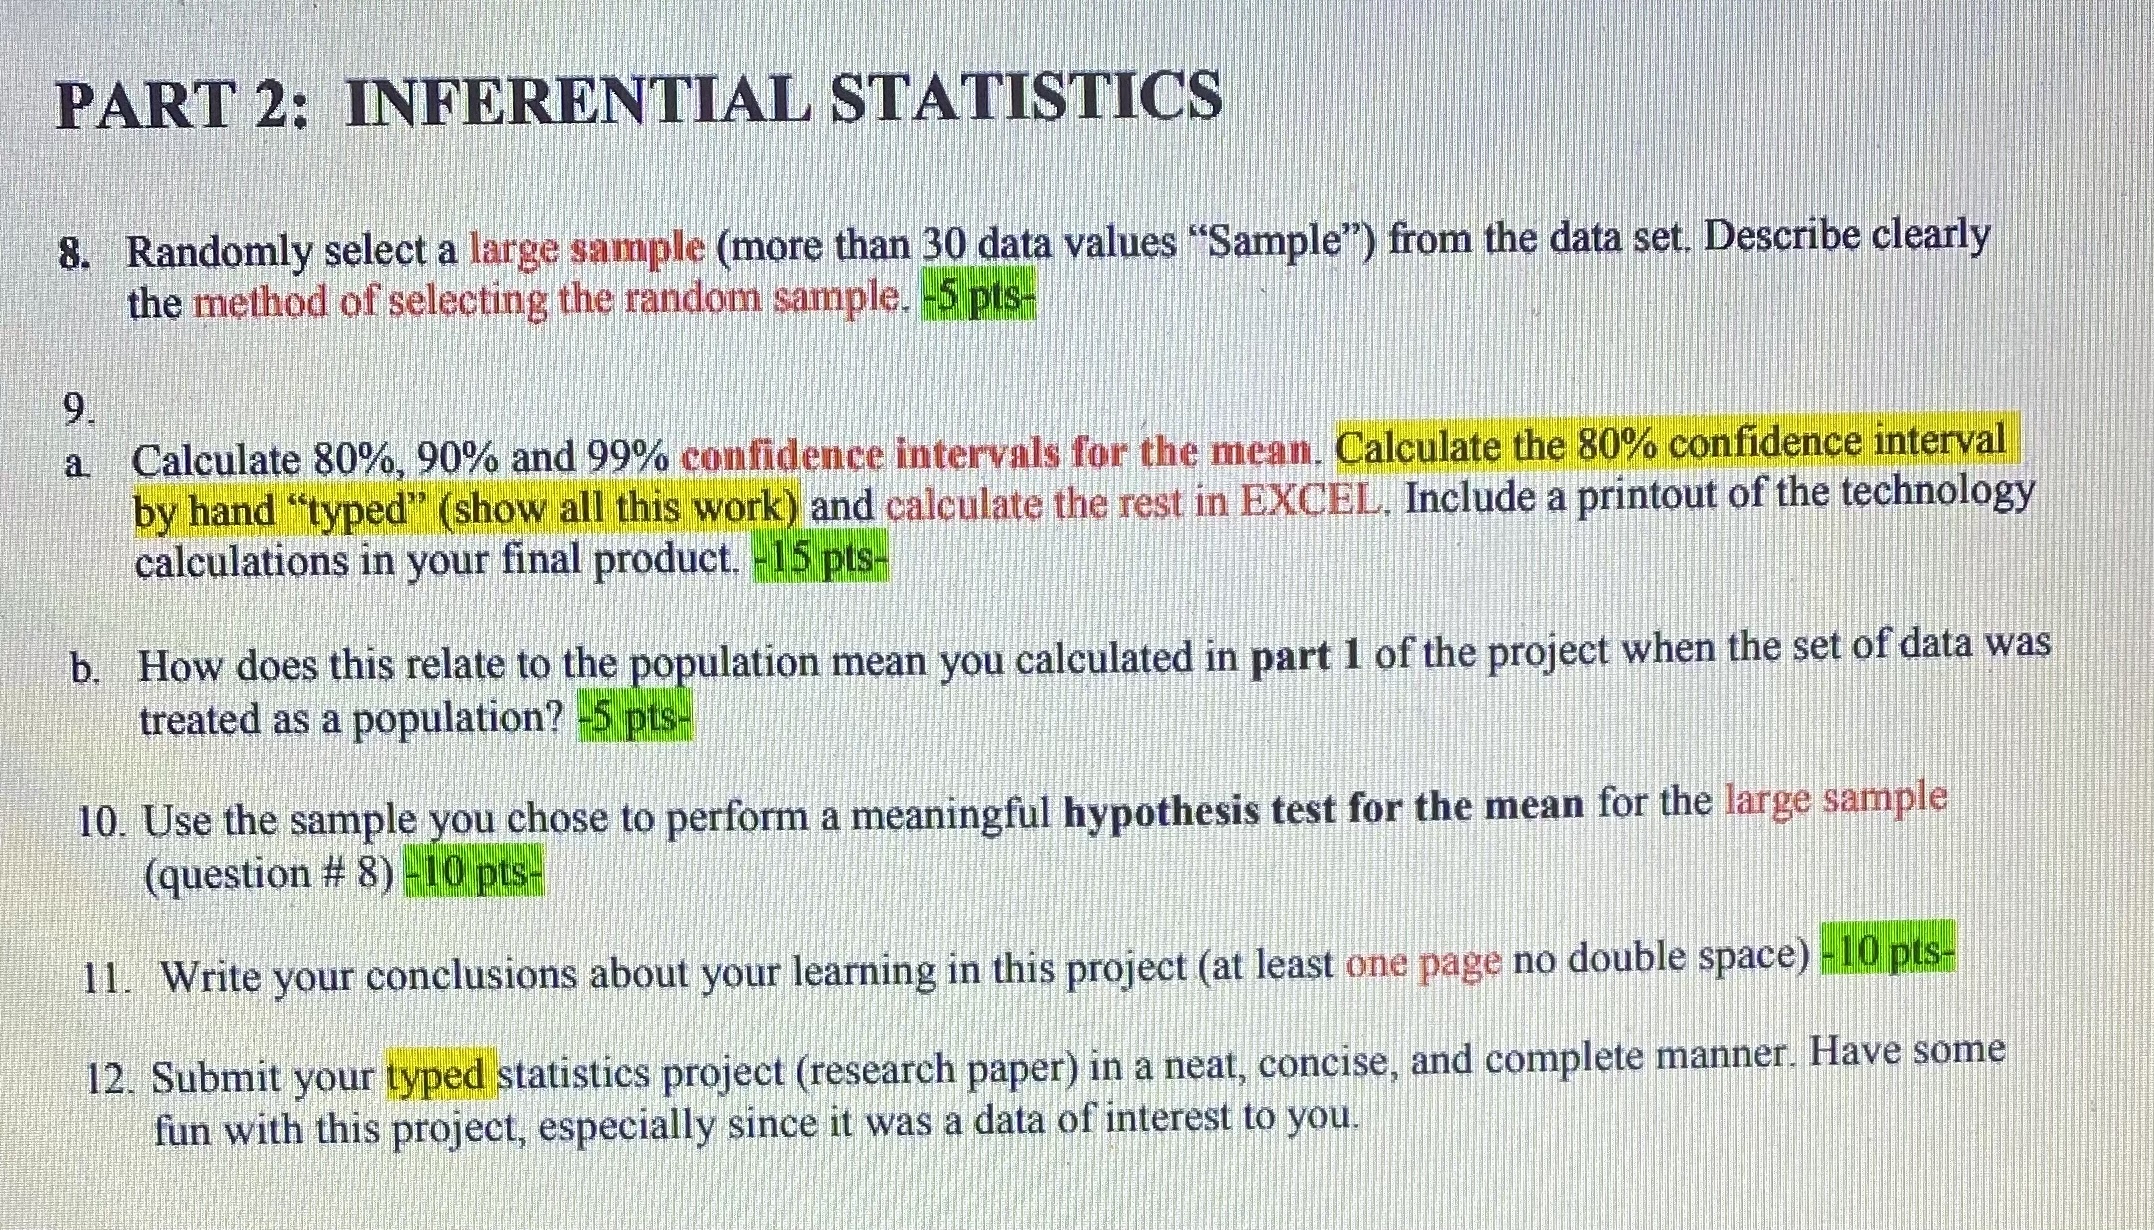
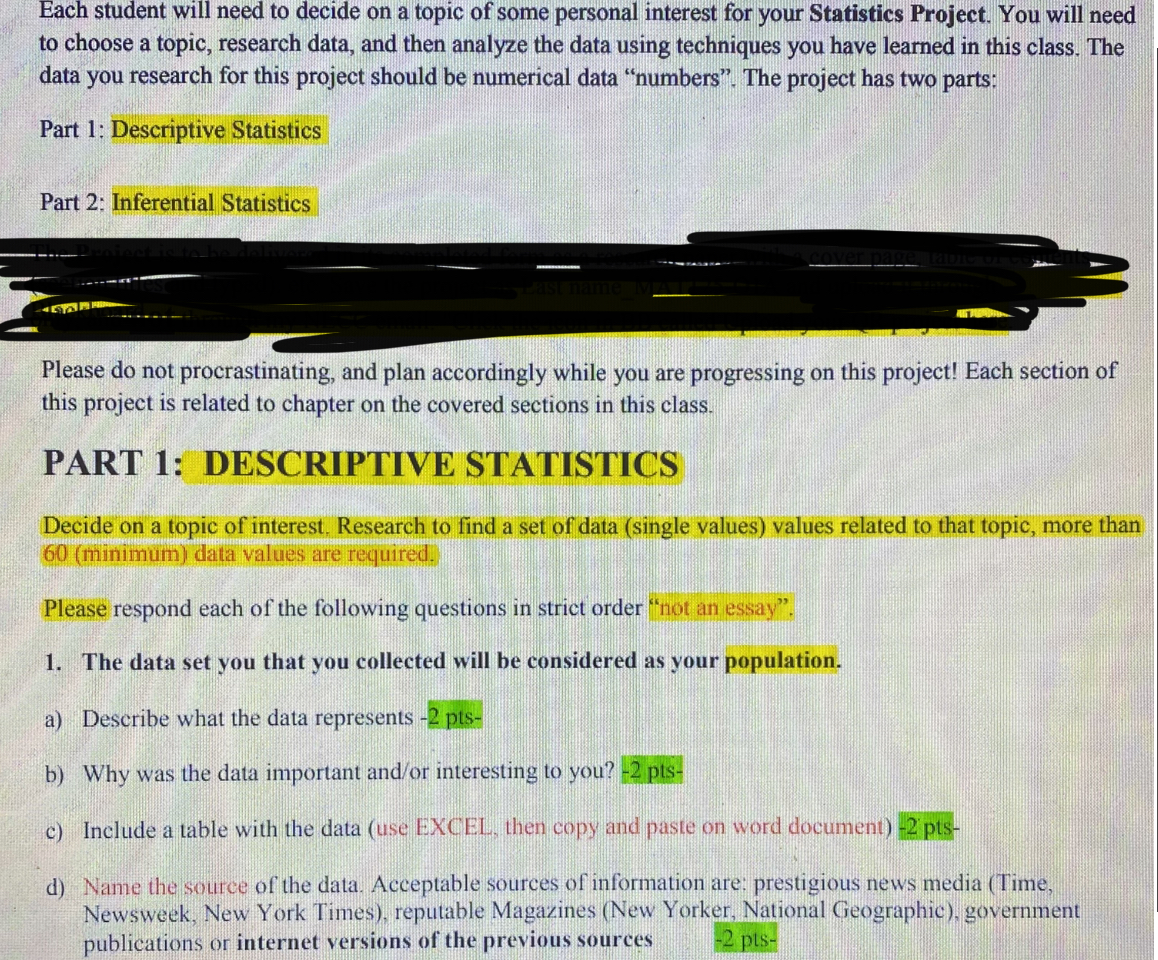
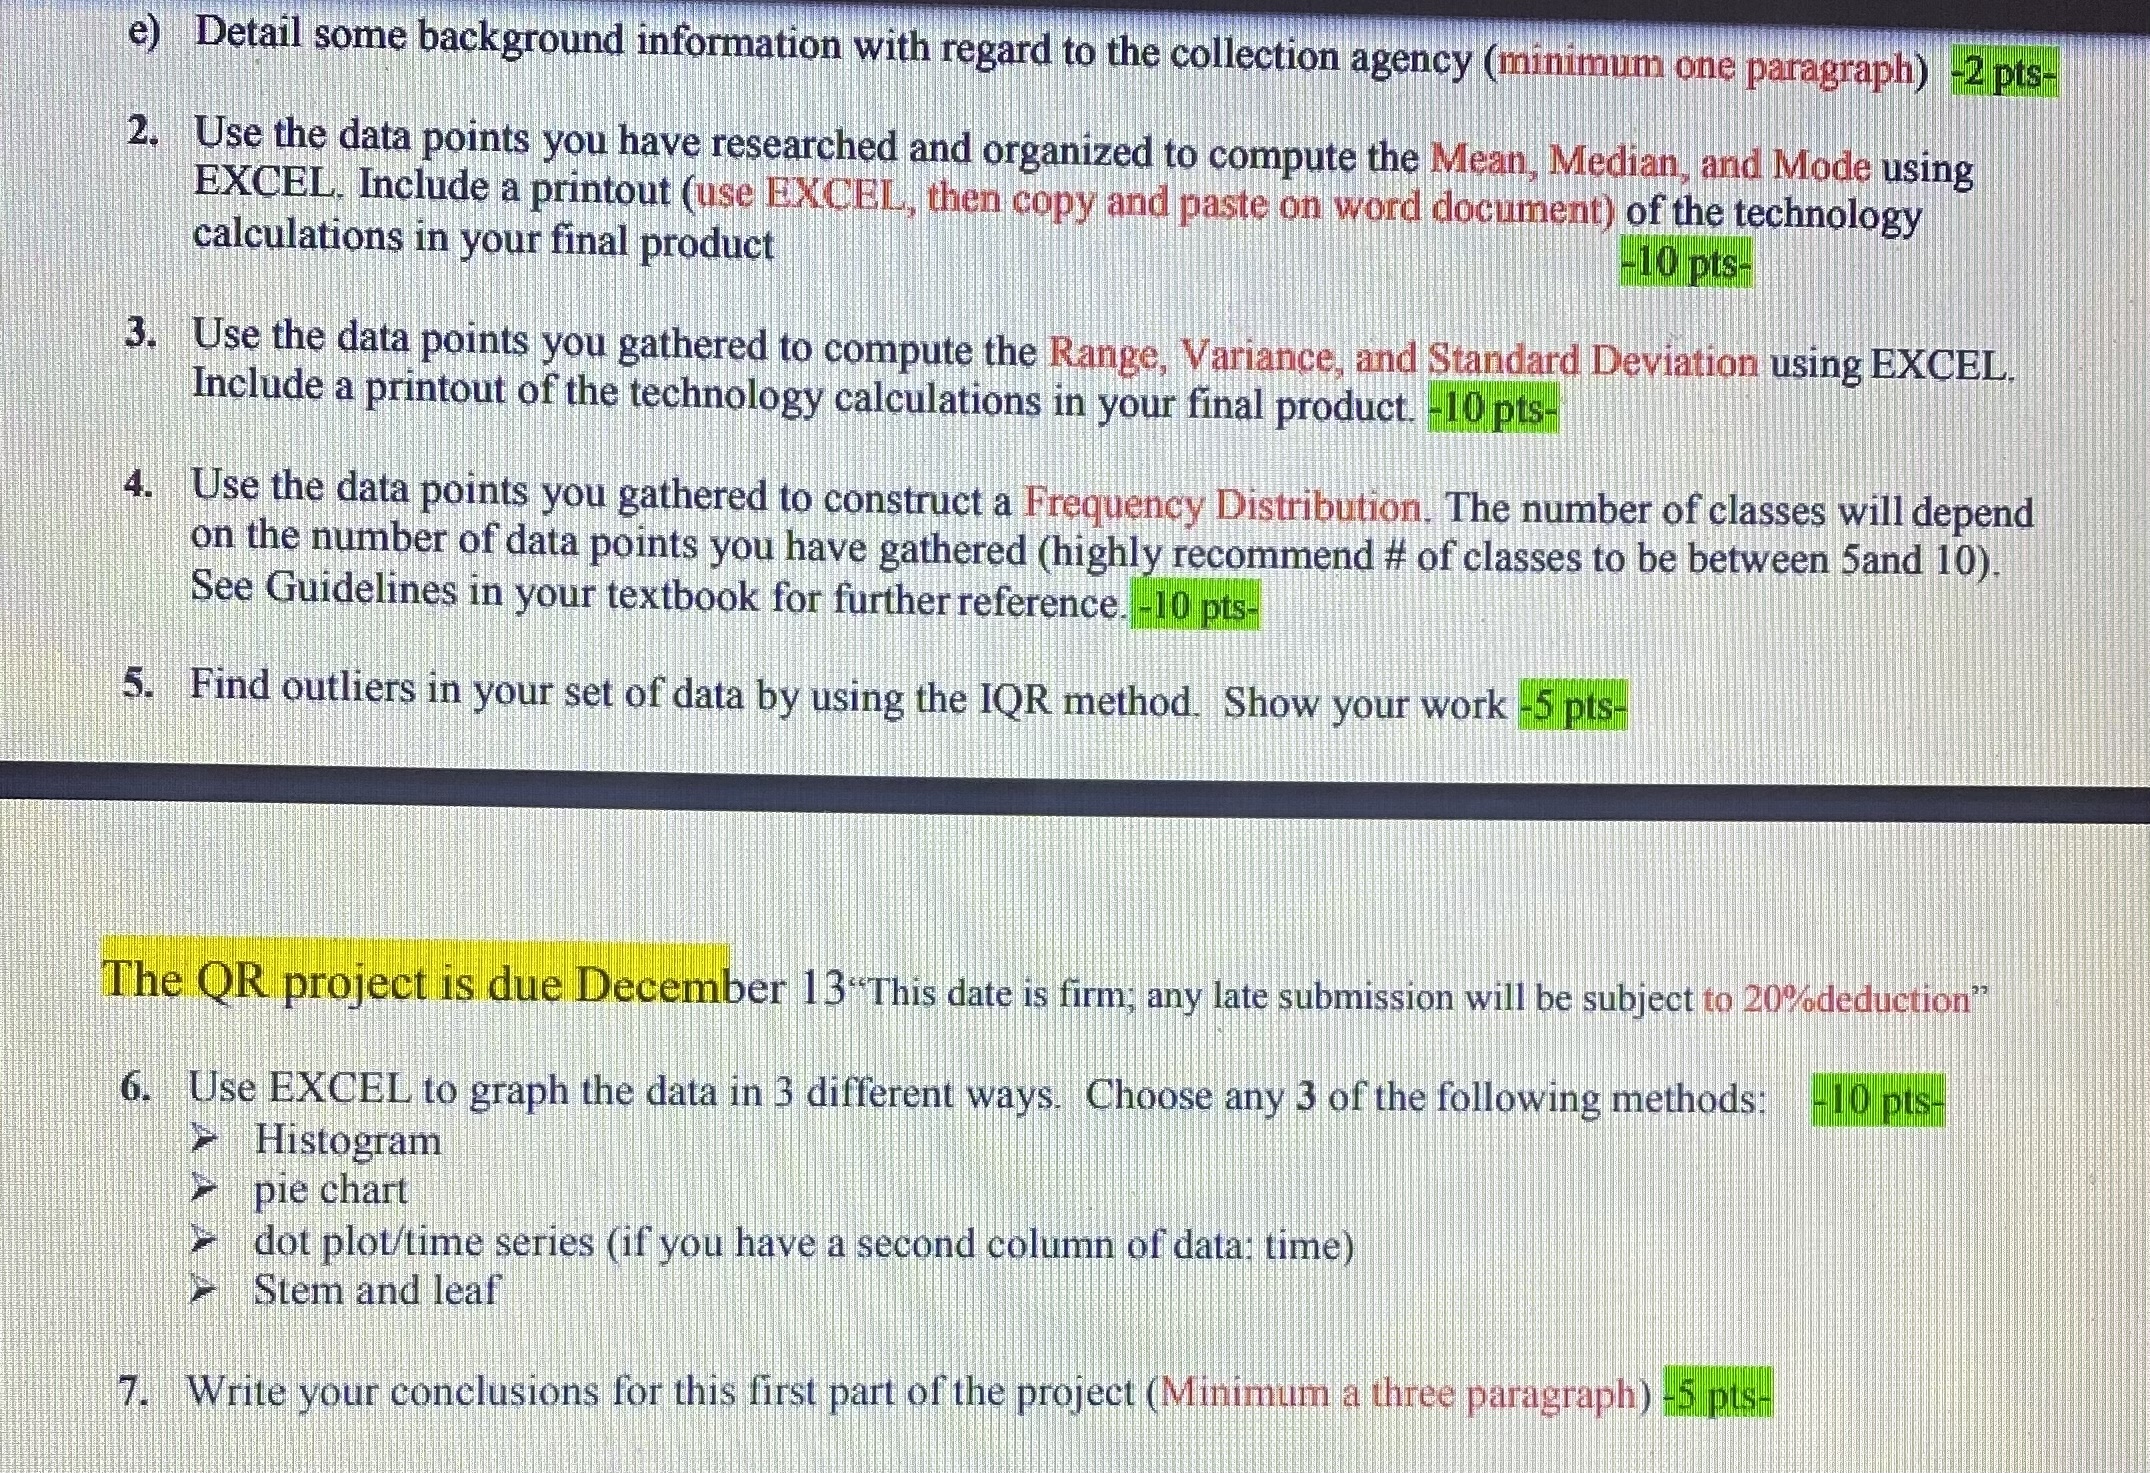
PART 2: INFERENTIAL STATISTICS 8. Randomly select a large sample (more than 30 data values "Sample") from the data set. Describe clearly the method of selecting the random sample. -5 pts 9. a Calculate 80%, 90% and 99% confidence intervals for the mean. Calculate the 80% confidence interval by hand "typed" (show all this work) and calculate the rest in EXCEL. Include a printout of the technology calculations in your final product. -15 pts- b. How does this relate to the population mean you calculated in part 1 of the project when the set of data was treated as a population? -5 pts- 10. Use the sample you chose to perform a meaningful hypothesis test for the mean for the large sample (question # 8) -10 pts 11. Write your conclusions about your learning in this project (at least one page no double space) - 10 pts 12. Submit your typed statistics project ( research paper) in a neat, concise, and complete manner. Have some fun with this project, especially since it was a data of interest to you.Each student will need to decide on a topic of some personal interest for your Statistics Project. You will need to choose a topic, research data, and then analyze the data using techniques you have learned in this class. The data you research for this project should be numerical data "numbers". The project has two parts: Part 1: Descriptive Statistics Part 2: Inferential Statistics Please do not procrastinating, and plan accordingly while you are progressing on this project! Each section of this project is related to chapter on the covered sections in this class. PART 1: DESCRIPTIVE STATISTICS Decide on a topic of interest, Research to find a set of data (single values) values related to that topic, more than 60 (minimum) data values are required.) Please respond each of the following questions in strict order "not an essay.. 1. The data set you that you collected will be considered as your population. a) Describe what the data represents -2 pts- b) Why was the data important and/or interesting to you? -2 pts- c) Include a table with the data (use EXCEL, then copy and paste on word document) -2 pts- d) Name the source of the data. Acceptable sources of information are; prestigious news media ( Time, Newsweek, New York Times), reputable Magazines (New Yorker, National Geographic), government publications or internet versions of the previous sources 12 pts-e) Detail some background information with regard to the collection agency (minimum one paragraph) -2 pts- 2. Use the data points you have researched and organized to compute the Mean, Median, and Mode using EXCEL. Include a printout (use EXCEL, then copy and paste on word document) of the technology calculations in your final product -10 pts- 3. Use the data points you gathered to compute the Range, Variance, and Standard Deviation using EXCEL Include a printout of the technology calculations in your final product. -10 pts- 4. Use the data points you gathered to construct a Frequency Distribution. The number of classes will depend on the number of data points you have gathered (highly recommend # of classes to be between 5and 10) See Guidelines in your textbook for further reference. -10 pts- 5. Find outliers in your set of data by using the IQR method. Show your work -5 pts- The QR project is due December 13"This date is firm; any late submission will be subject to 20%deduction" 6. Use EXCEL to graph the data in 3 different ways. Choose any 3 of the following methods: -10 pts- Histogram pie chart dot plot/time series (if you have a second column of data; time) Stem and leaf 7. Write your conclusions for this first part of the project (Minimum a three paragraph) -5 pus
Step by Step Solution
There are 3 Steps involved in it

Get step-by-step solutions from verified subject matter experts