

Question: I need help with this question 22) Managers rate employees according to job performance and attitude. The results for several randomly selected employees are given
I need help with this question
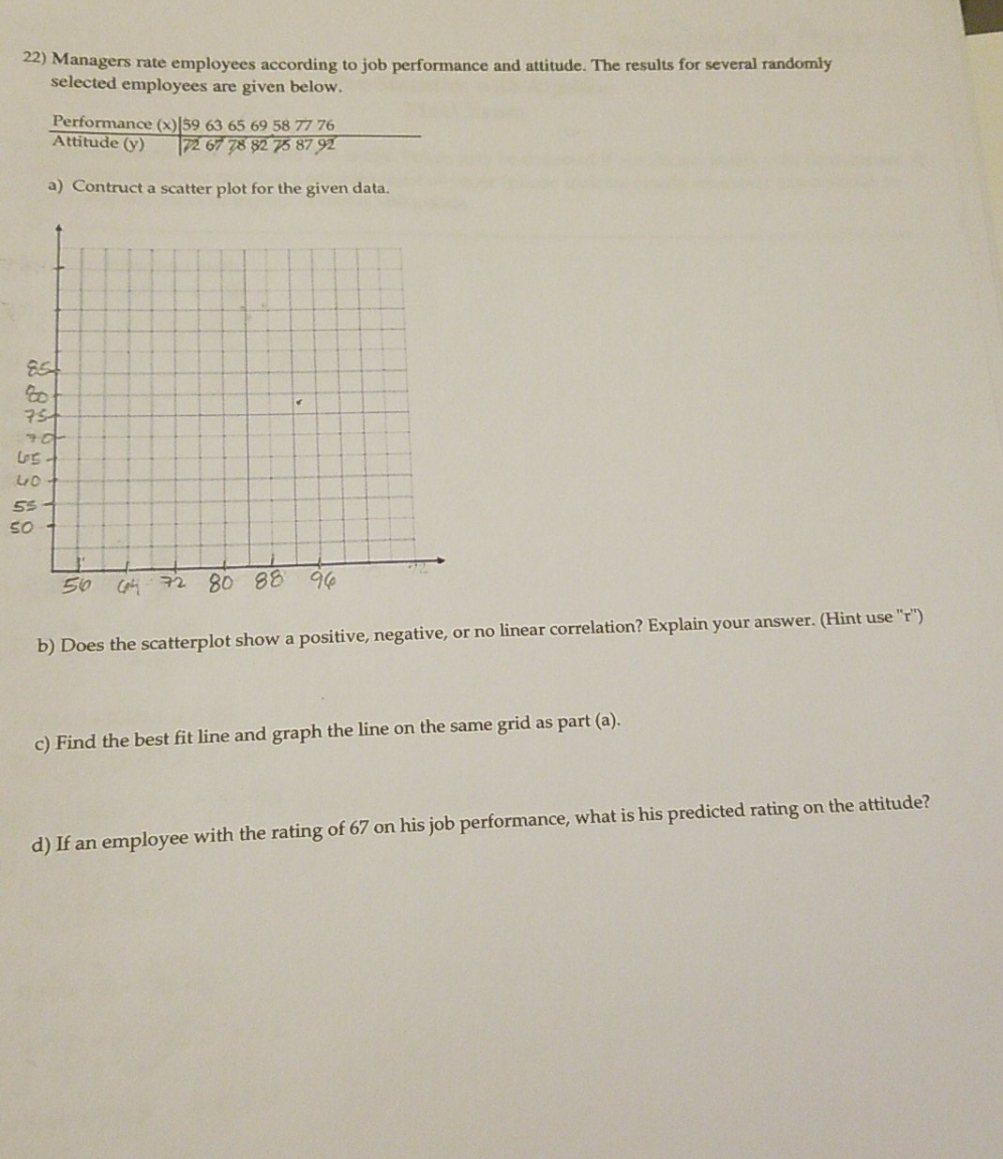
22) Managers rate employees according to job performance and attitude. The results for several randomly selected employees are given below. Performance (x)|59 63 65 69 58 77 76 Attitude (y) 72 67 78 82 75 87 92 a) Contructa scatter plot for the given data. 85 75 70 55 50 50 64 72 80 88 94 b) Does the scatterplot show a positive, negative, or no linear correlation? Explain your answer. (Hint use "r") c) Find the best fit line and graph the line on the same grid as part (a). d) If an employee with the rating of 67 on his job performance, what is his predicted rating on the attitude
Step by Step Solution
There are 3 Steps involved in it
1 Expert Approved Answer
Step: 1 Unlock

Question Has Been Solved by an Expert!
Get step-by-step solutions from verified subject matter experts
Step: 2 Unlock
Step: 3 Unlock