

Question: I need help with this question. 60 % wearing helmets 50 40 30 20 10 20 40 60 80 % receiving reduced-fee lunch The scatterplot
I need help with this question.
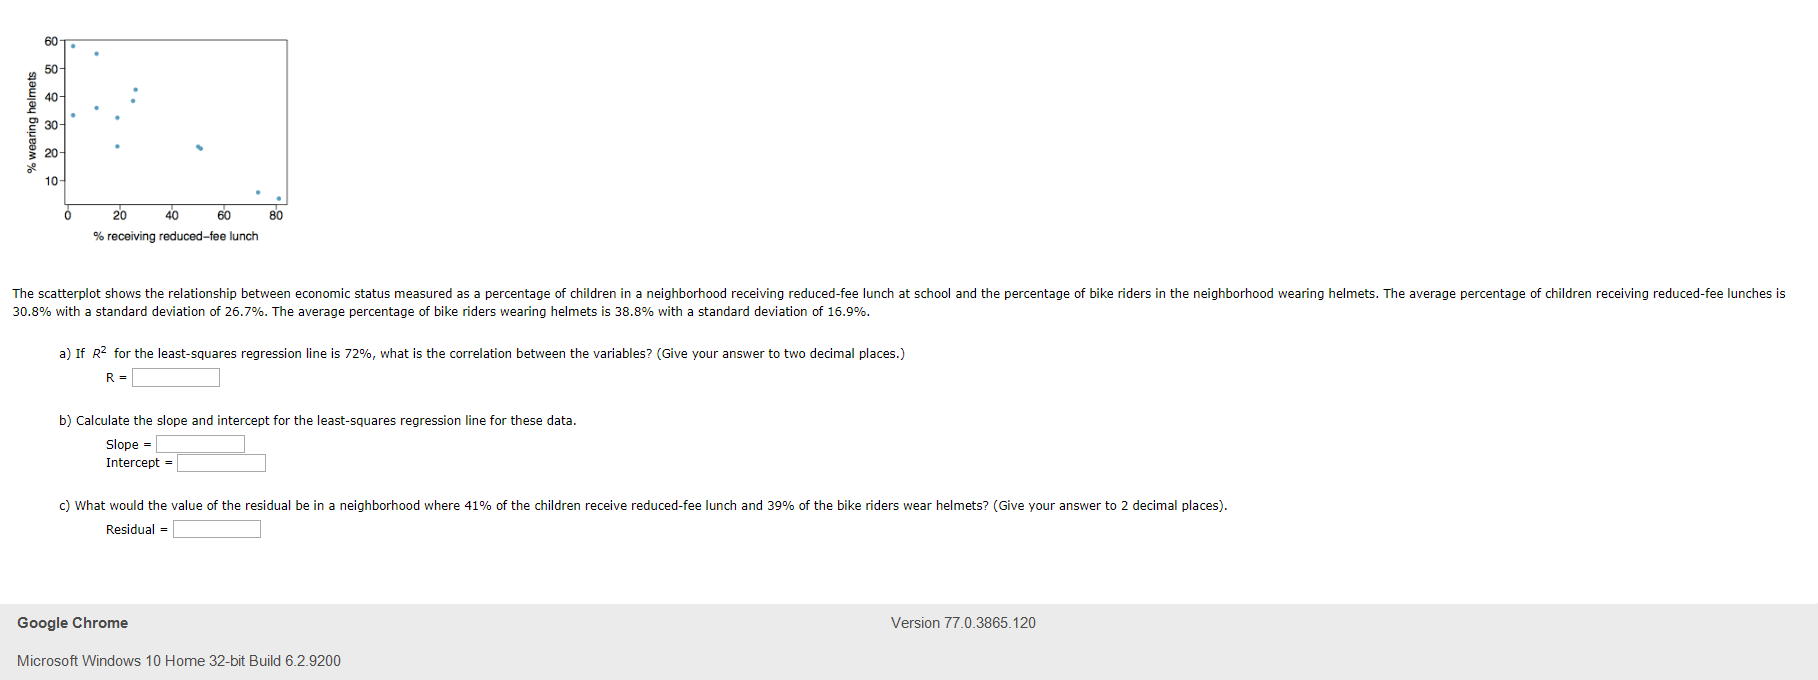
60 % wearing helmets 50 40 30 20 10 20 40 60 80 % receiving reduced-fee lunch The scatterplot shows the relationship between economic status measured as a percentage of children in a neighborhood receiving reduced-fee lunch at school and the percentage of bike riders in the neighborhood wearing helmets. The average percentage of children receiving reduced-fee lunches is 30.8% with a standard deviation of 26.7%. The average percentage of bike riders wearing helmets is 38.8% with a standard deviation of 16.9%. a) If RZ for the least-squares regression line is 72%, what is the correlation between the variables? (Give your answer to two decimal places.) R = b) Calculate the slope and intercept for the least-squares regression line for these data. Slope = Intercept = c) What would the value of the residual be in a neighborhood where 41% of the children receive reduced-fee lunch and 39% of the bike riders wear helmets? (Give your answer to 2 decimal places). Residual = Google Chrome Version 77.0.3865.120 Microsoft Windows 10 Home 32-bit Build 6.2.9200
Step by Step Solution
There are 3 Steps involved in it

Get step-by-step solutions from verified subject matter experts