

Question: Nine homes are chosen at random from real estate listings in two suburban neighborhoods, and the square footage of each home is noted in
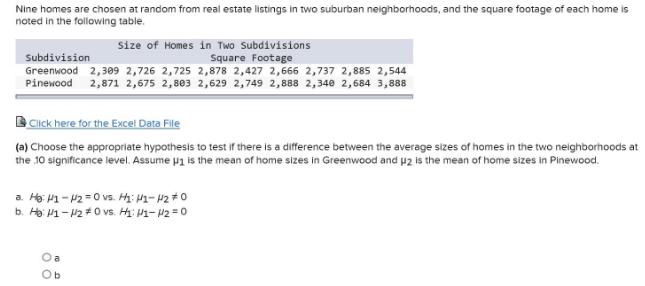
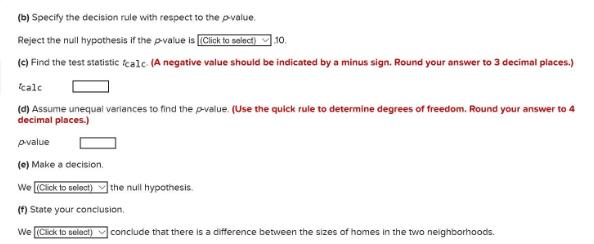
Nine homes are chosen at random from real estate listings in two suburban neighborhoods, and the square footage of each home is noted in the following table. Size of Homes in Two Subdivisions Square Footage Subdivision Greenwood 2,309 2,726 2,725 2,878 2,427 2,666 2,737 2,885 2,544 Pinewood 2,871 2,675 2,803 2,629 2,749 2,888 2,340 2,684 3,888 B Click here for the Excel Data File (a) Choose the appropriate hypothesis to test if there is a difference between the average sizes of homes in the two neighborhoods at the 10 significance level. Assume p1 is the mean of home sizes in Greenwood and uz is the mean of home sizes in Pinewood. a. Ho H1- 42 =0 vs. H: P1- 42 *0 b. Ho P1- 12 #0 vs. H V1- 12=0 O a Ob (b) Specify the decision rule with respect to the pvalue. Reject the null hypothesis if the pvalue is [Cisk to select) (c) Find the test statistic tcalc (A negative value should be indicated by a minus sign. Round your answer to 3 decimal places.) 10. kalc (d) Assume unequal variances to find the pvalue. (Use the quick rule to determine degrees of freedom. Round your answer to 4 decimal places.) pvalue (0) Make a decision. We (Cick to seloct) the null hypothesis (1) State your conclusion, We (Cick to selact) conclude that there is a difference between the sizes of homes in the two neighborhoods.
Step by Step Solution
3.41 Rating (154 Votes )
There are 3 Steps involved in it
To solve this hypothesis testing problem follow these steps a Hypotheses Choose the appropriate hypo... View full answer

Get step-by-step solutions from verified subject matter experts