

Question: I need help with this question 66, 72, 77, 78, 78, 80, 82, 84, 84, 87, 88, 88, 89, 89, 90, 92, 92, 93, 94,
I need help with this question
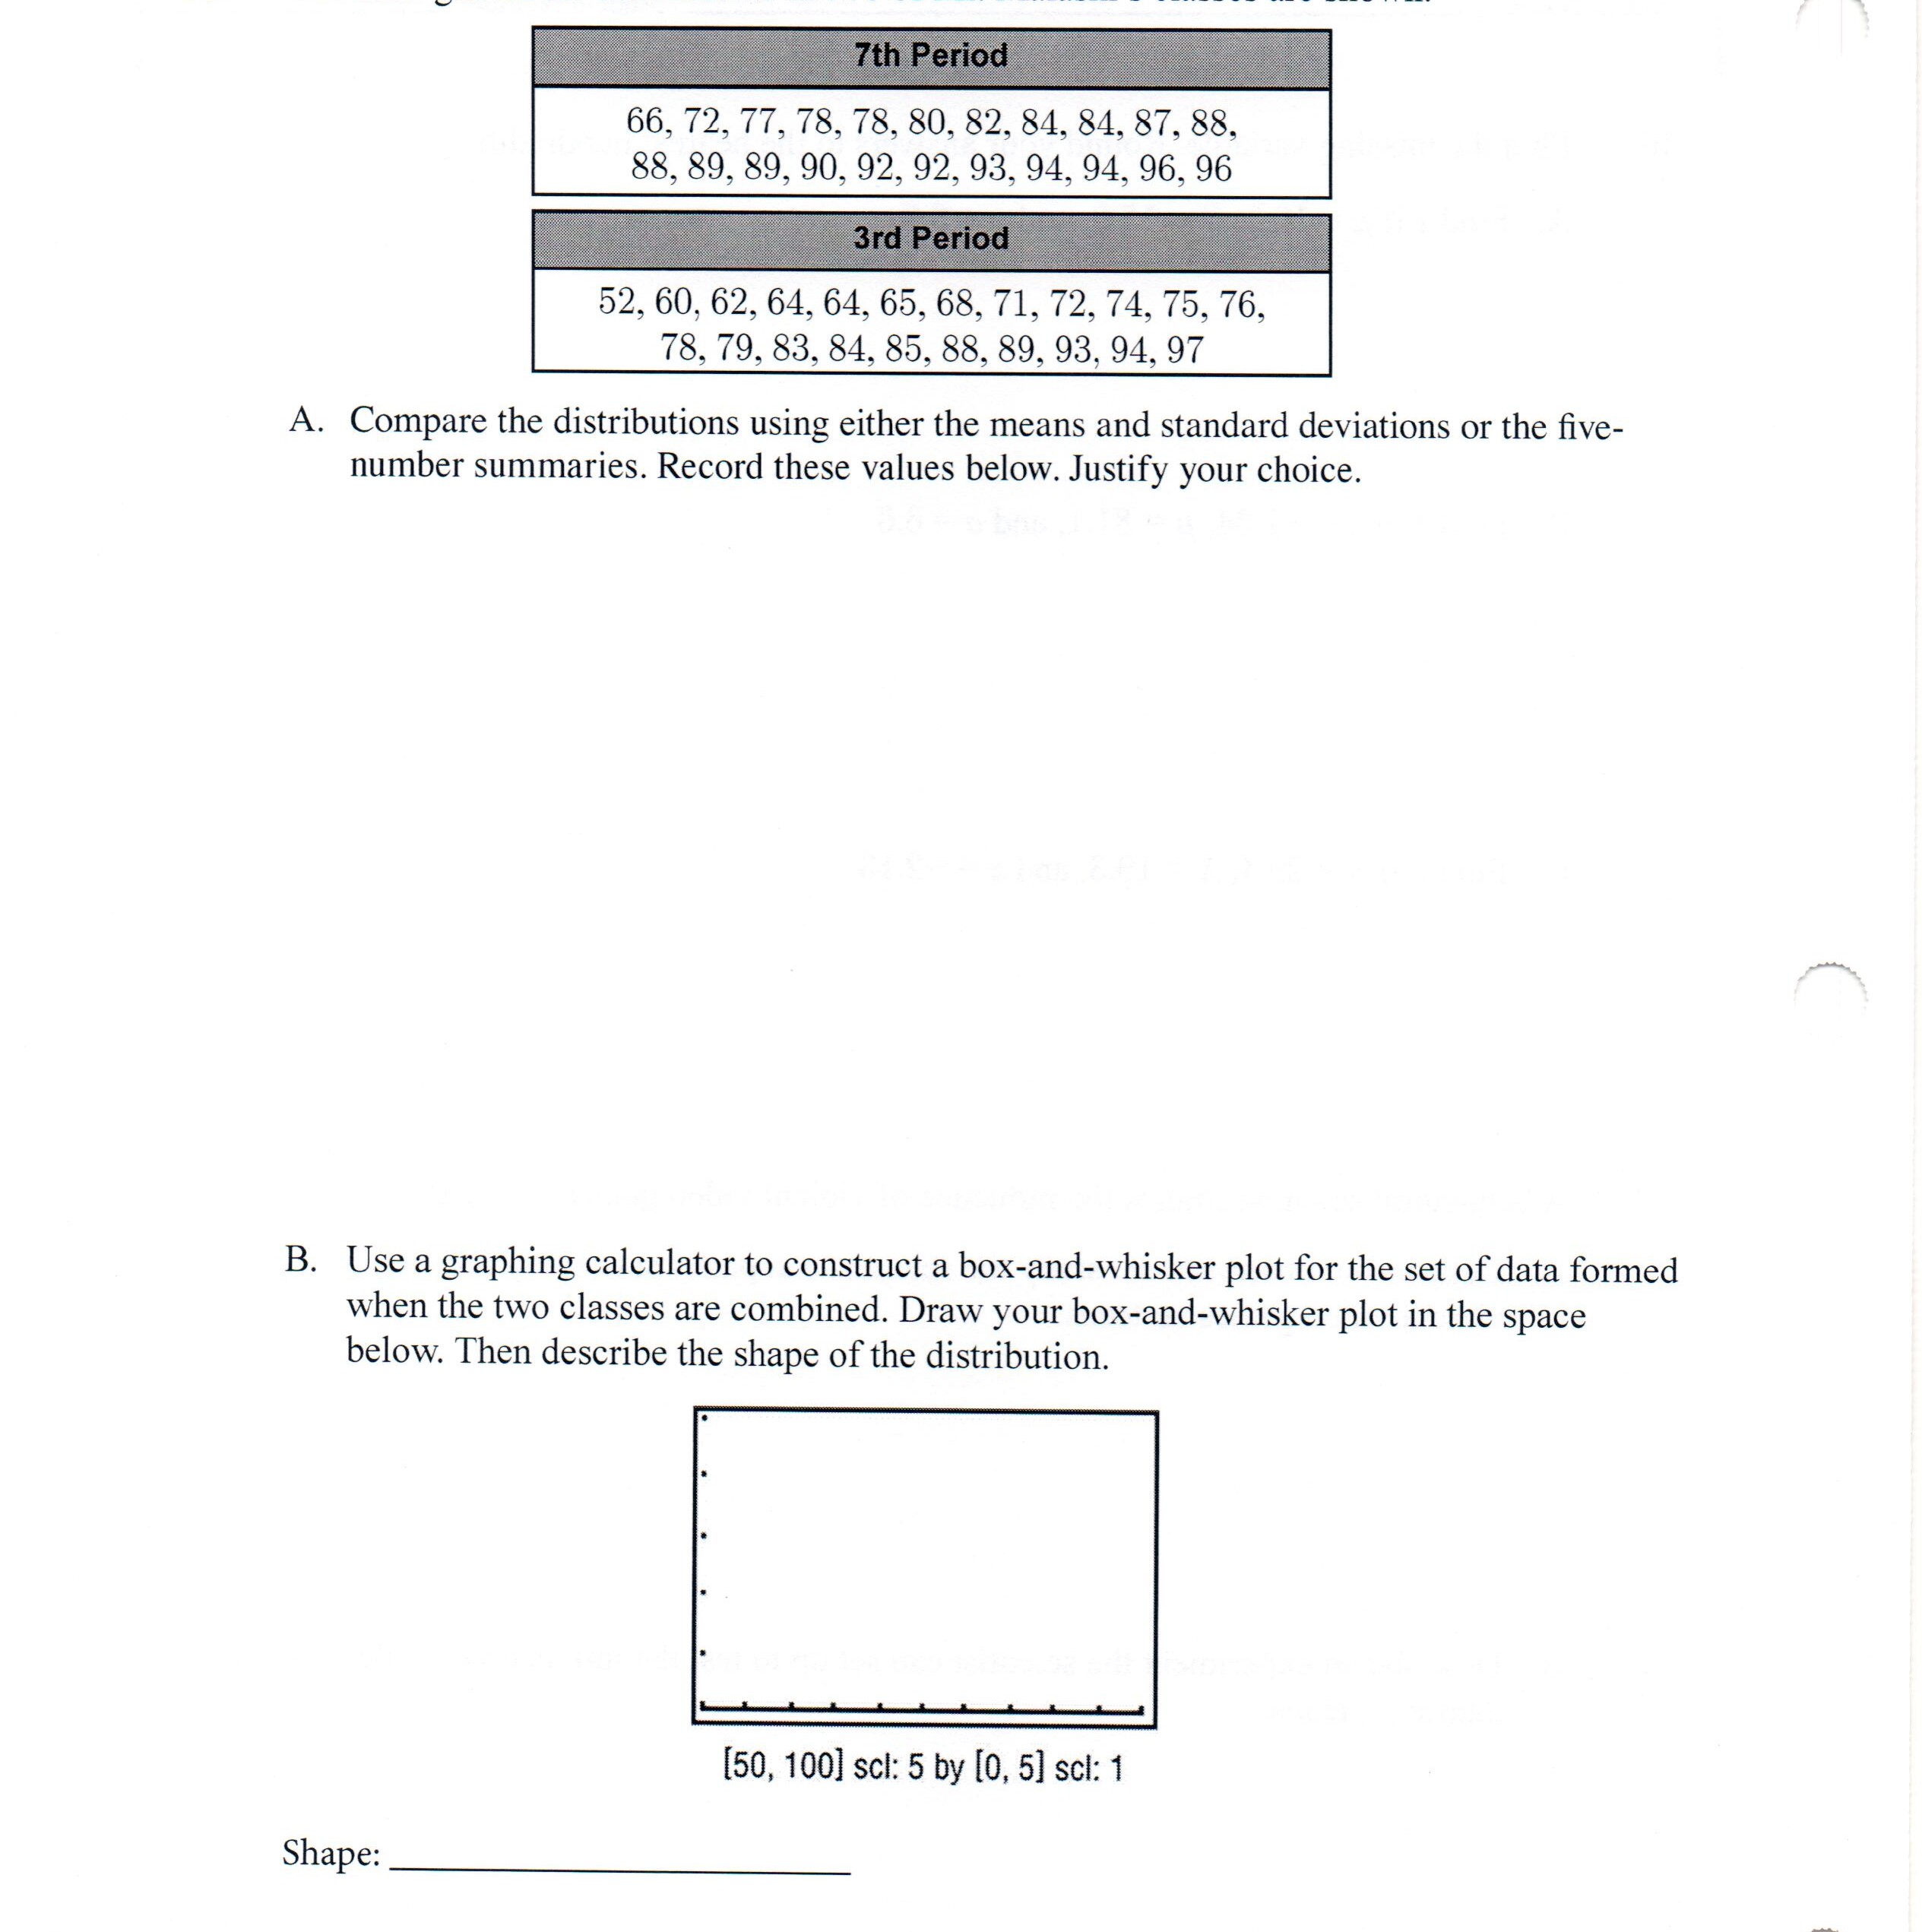
66, 72, 77, 78, 78, 80, 82, 84, 84, 87, 88, 88, 89, 89, 90, 92, 92, 93, 94, 94, 96, 96 52, 60, 62, 64, 64, 65, 68, 71, 72, 74, 75, 76, 78, 79, 83, 84, 85, 88, 89, 93, 94, 97 A. Compare the distributions using either the means and standard deviations or the ve- number summaries. Record these values below. Justify your choice. B. Use a graphing calculator to construct a box-andwhjsker plot for the set of data formed when the two classes are combined. Draw your box-and-whisker plot in the space below. Then describe the shape of the distribution. [50, 1001 301:5 by [0, 51 sci: 1 Shape
Step by Step Solution
There are 3 Steps involved in it
1 Expert Approved Answer
Step: 1 Unlock

Question Has Been Solved by an Expert!
Get step-by-step solutions from verified subject matter experts
Step: 2 Unlock
Step: 3 Unlock