

Question: I need help with this question can you draw a graph with points to show me udent/PlayerTest.aspx?testid=215494012¢erwin=yes X ECON1010:911 Intro to Economic Issues, Summer 2020
I need help with this question can you draw a graph with points to show me
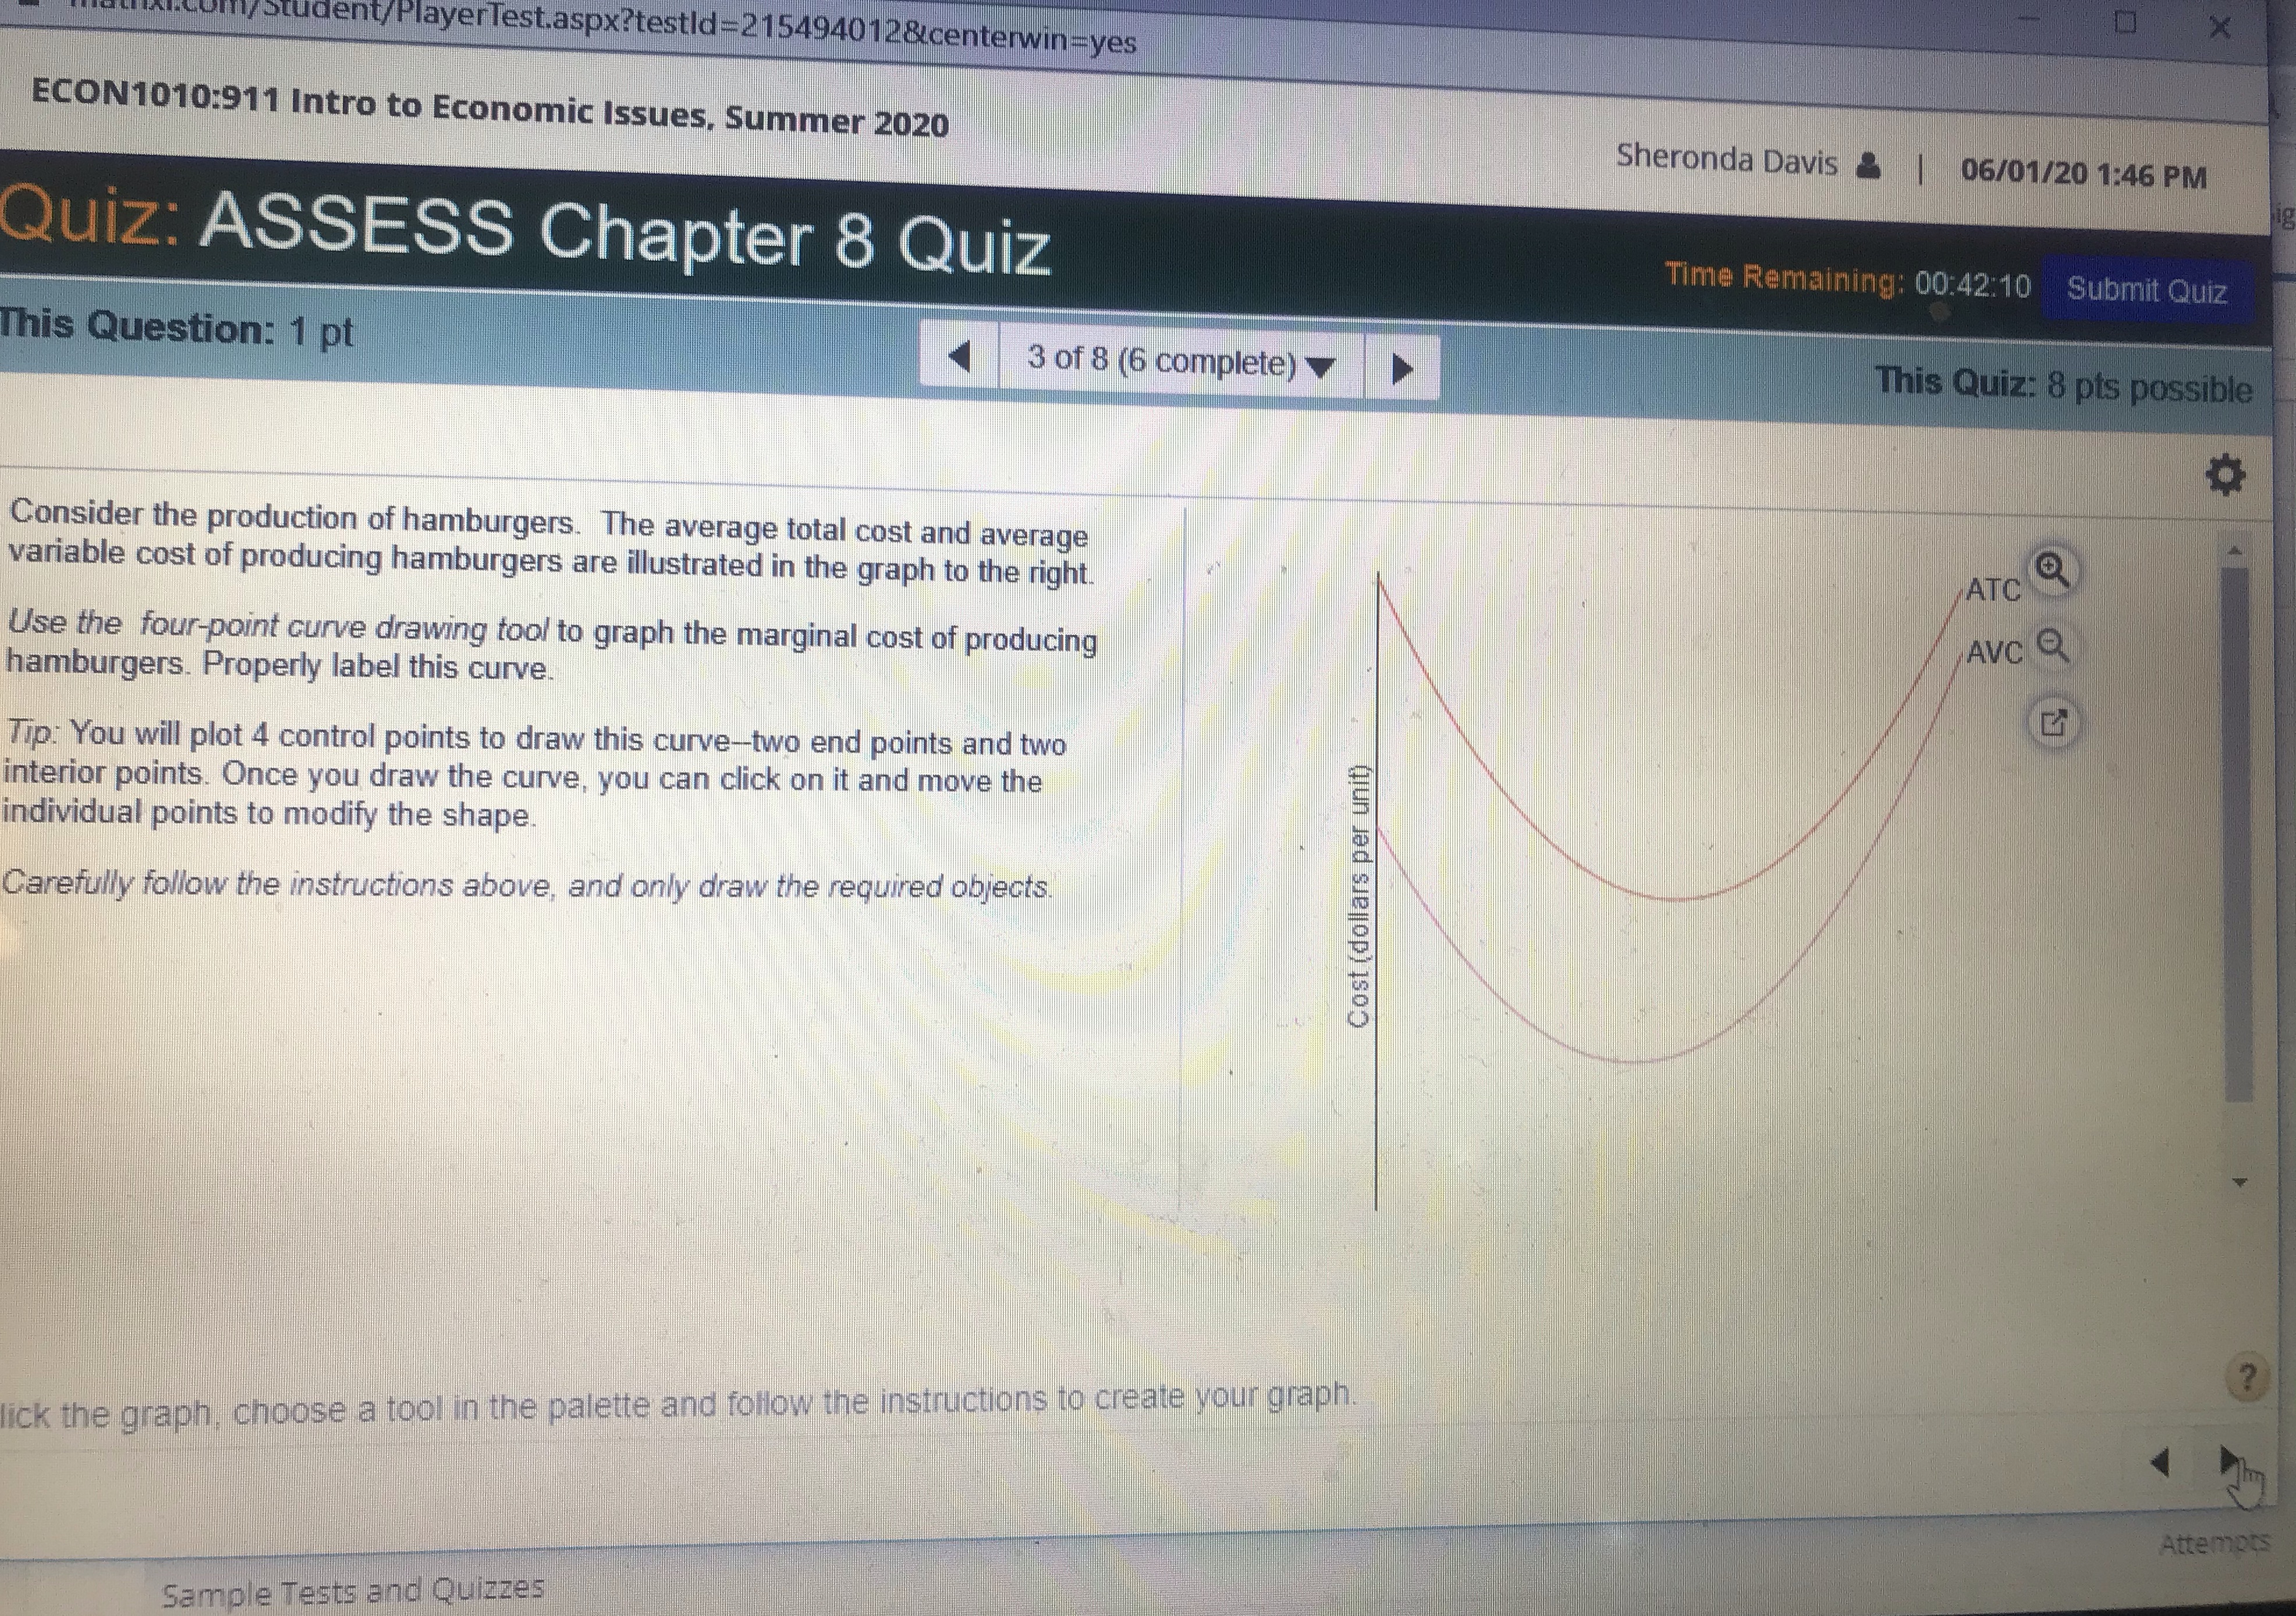
udent/PlayerTest.aspx?testid=215494012¢erwin=yes X ECON1010:911 Intro to Economic Issues, Summer 2020 Sheronda Davis 2 06/01/20 1:46 PM Quiz: ASSESS Chapter 8 Quiz Time Remaining: 00:42:10 Submit Quiz This Question: 1 pt 3 of 8 (6 complete) This Quiz: 8 pts possible Consider the production of hamburgers. The average total cost and average variable cost of producing hamburgers are illustrated in the graph to the right ATC Use the four-point curve drawing tool to graph the marginal cost of producing AVC hamburgers. Properly label this curve. Tip: You will plot 4 control points to draw this curve-two end points and two interior points. Once you draw the curve, you can click on it and move the individual points to modify the shape. Carefully follow the instructions above, and only draw the required objects Cost (dollars per unit) ? ick the graph. choose a tool in the palette and follow the instructions to create your graph. Attempts Sample Tests and Quizzes
Step by Step Solution
There are 3 Steps involved in it

Get step-by-step solutions from verified subject matter experts