Question: I NEED HELP WITH THIS QUESTION!!! Using an SPC Chart to Examine American Airlines' Pilots Sick Out Source: American Airlines Flight Delays Pile Up, Wall
I NEED HELP WITH THIS QUESTION!!!
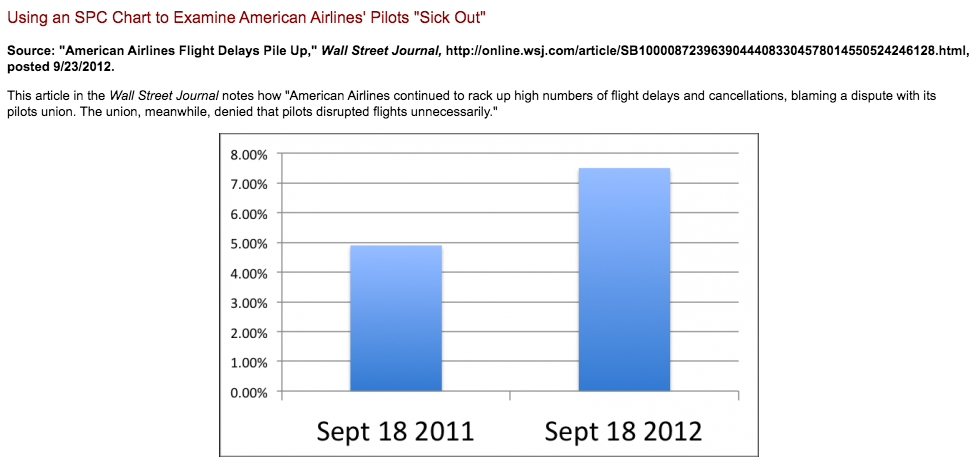
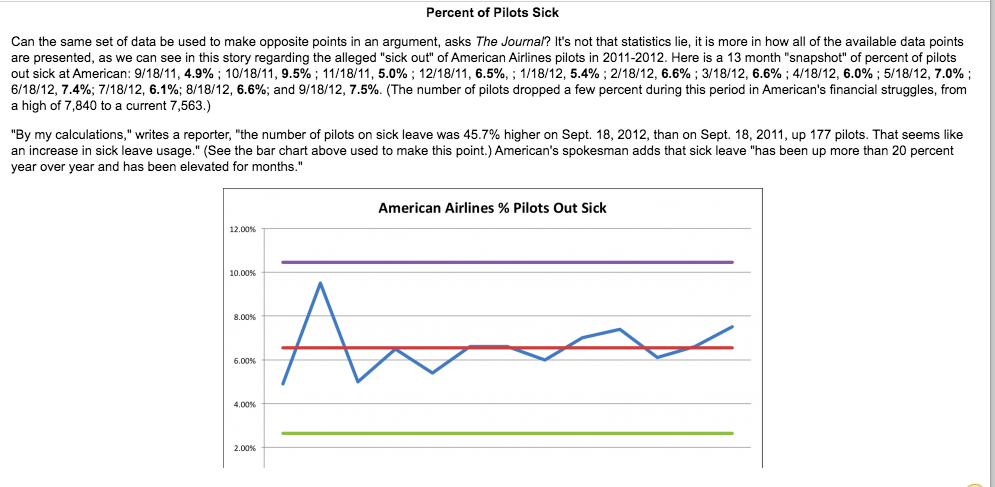
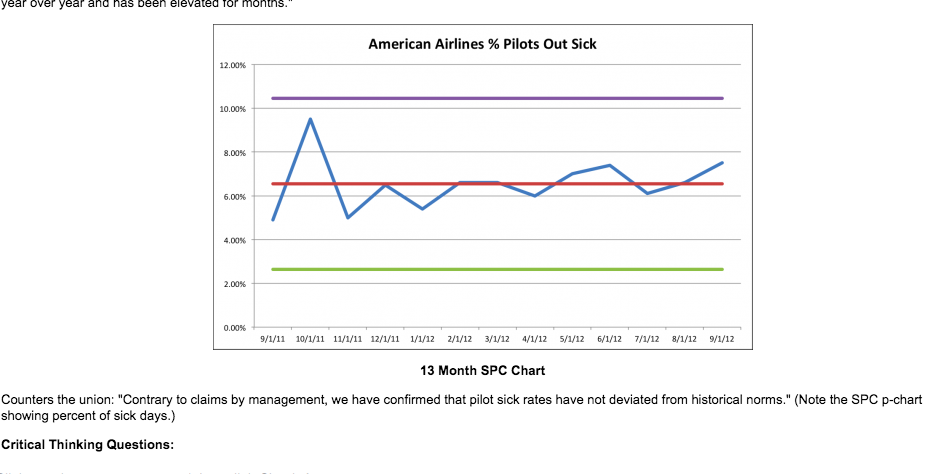
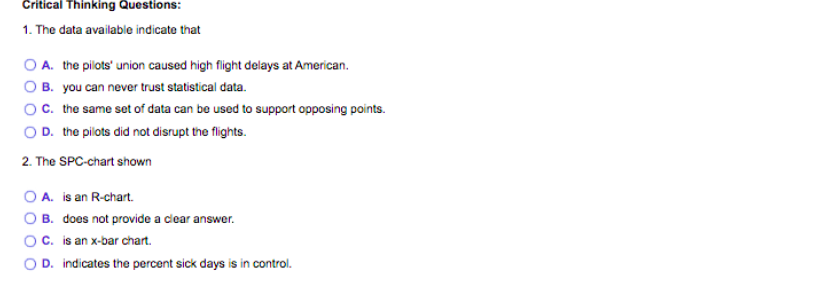
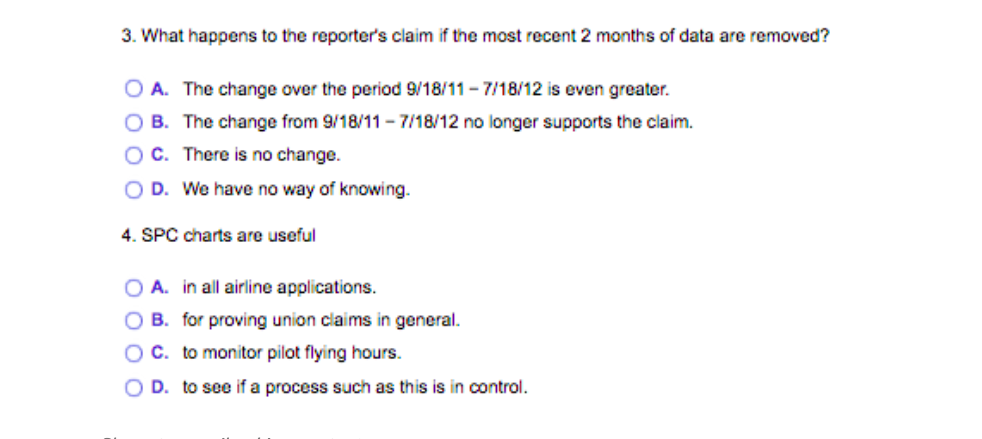
Using an SPC Chart to Examine American Airlines' Pilots "Sick Out" Source: "American Airlines Flight Delays Pile Up," Wall Street Journal, http://online.wsj.com/article/SB10000872396390444083304578014550524246128.html, posted 9/23/2012. This article in the Wall Street Journal notes how "American Airlines continued to rack up high numbers of flight delays and cancellations, blaming a dispute with its pilots union. The union, meanwhile, denied that pilots disrupted flights unnecessarily." 8.00% 7.00% 6.00% 5.00% 4.00% 3.00% 2.00% 1.00% 0.00% Sept 18 2011 Sept 18 2012 Percent of Pilots Sick Can the same set of data be used to make opposite points in an argument, asks The Journal? It's not that statistics lie, it is more in how all of the available data points are presented, as we can see in this story regarding the alleged "sick out" of American Airlines pilots in 2011-2012. Here is a 13 month "snapshot" of percent of pilots out sick at American: 9/18/11, 4.9%; 10/18/11, 9.5% ; 11/18/11, 5.0% ; 12/18/11, 6.5%, ; 1/18/12, 5.4%; 2/18/12, 6.6%; 3/18/12, 6.6%; 4/18/12, 6.0%; 5/18/12, 7.0% ; 6/18/12, 7.4%; 7/18/12, 6.1%; 8/18/12, 6.6%; and 9/18/12, 7.5%. (The number of pilots dropped a few percent during this period in American's financial struggles, from a high of 7,840 to a current 7,563.) "By my calculations," writes a reporter, "the number of pilots on sick leave was 45.7% higher on Sept. 18, 2012, than on Sept. 18, 2011, up 177 pilots. That seems like an increase in sick leave usage." (See the bar chart above used to make this point.) American's spokesman adds that sick leave "has been up more than 20 percent year over year and has been elevated for months." American Airlines % Pilots Out Sick 12.00% 10.00% 8.00% 6.00% 4.00% 2.00% year over year and has been elevated for months. American Airlines % Pilots Out Sick 12.00% 10.00% 8.00% 6.00% 4.00% 2.00% 0.00% 9/1/11 10/1/11 11/1/11 12/1/11 1/1/12 2/1/12 3/1/12 4/1/12 5/1/12 6/1/12 7/1/12 8/1/12 9/1/12 13 Month SPC Chart Counters the union: "Contrary to claims by management, we have confirmed that pilot sick rates have not deviated from historical norms." (Note the SPC p-chart showing percent of sick days.) Critical Thinking Questions: Critical Thinking Questions: 1. The data available indicate that O A. the pilots' union caused high flight delays at American. O B. you can never trust statistical data. OC. the same set of data can be used to support opposing points. OD. the pilots did not disrupt the flights. 2. The SPC-chart shown O A. is an R-chart. O B. does not provide a clear answer. O c. is an x-bar chart OD. indicates the percent sick days is in control. 3. What happens to the reporter's claim if the most recent 2 months of data are removed? A. The change over the period 9/18/11 - 7/18/12 is even greater. OB. The change from 9/18/11 - 7/18/12 no longer supports the claim. OC. There is no change. OD. We have no way of knowing. 4. SPC charts are useful O A. in all airline applications. B. for proving union claims in general. OC. to monitor pilot flying hours. OD. to see if a process such as this is in control


