

Question: I need help with this r code. I was able to do the first question and I did the second one but I'm not sure
I need help with this r code. I was able to do the first question and I did the second one but I'm not sure if it's right and I'm not sure how to do the rest. It would be great if you could do the coding using only data.table, ggplot2, and sandwich packages because those are the packages I have access to. I also added a sample of the data.
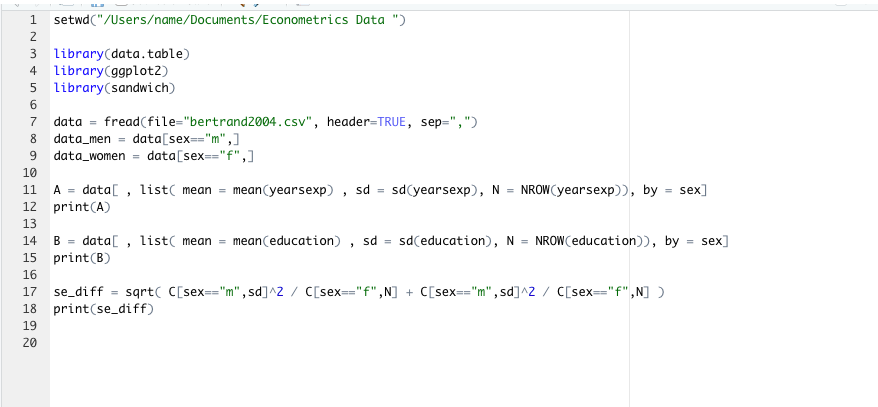
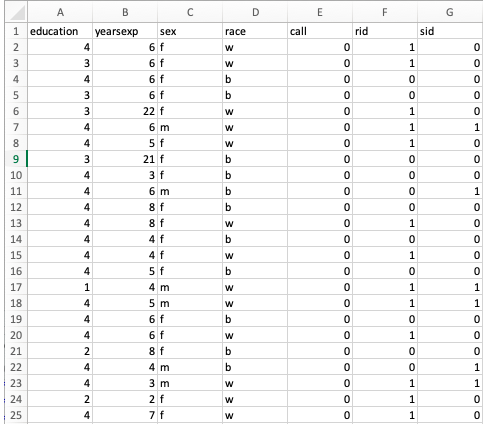
2. Calculate the mean years of experience and education by sex. 3. Calculate the standard errors and do a t-test (by hand or using the test commands) for whether years of experience or education are different by sex. 4. Now, using the same commands (or any other commands you prefer), calculate the difference in call back rates by sex. 5. Finally, do a t-test to see if these differences are statistically significant. You may do this by hand, with the t. test command, or with any other command.setwd("/Usersame/Documents/Econometrics Data ") Library(data. table) 4 Library(ggplotz) 5 Library(sandwich) 6 data = fread(file="bertrand2004.csv", header=TRUE, sep=","> 8 data_men = data[sex=="m",] 9 data_women = data [sex=="f",] 10 11 A = data[ , list( mean = mean(yearsexp) , sd = sd(yearsexp), N = NROW(yearsexp)), by = sex] 12 print(A) 13 14 B = data[ , list( mean = mean(education) , sd = sd(education), N = NROW(education)), by = sex] 15 print (B) 16 17 se_diff = sqrt( C[sex=="m", sd]^2 / C[sex=="f",N] + C[sex=="m", sd]^2 / C[sex=="f" , N] > 18 print(se_diff) 19 20D G A B C E education yearsexp Sex race call rid sid 4 6 f W 3 6 f W 6 f 6 f 22 f W 6 m W 5 f W 21 f b 3 f b 11 4 6 m b 12 8 f b 13 8 f W O O K K O O O K K O O O O O K O O O K O 0 0 0 0 oooooo ooo ooo ooo ooo o o o o 0 0 14 A 4 f 15 4 f W 16 4 5 f b 17 4 m W H 18 A 5 m W 19 6 f 20 6 f W 21 2 8 f b 22 A 4 m b 23 W 24 2 f W 25 7 f W
Step by Step Solution
There are 3 Steps involved in it

Get step-by-step solutions from verified subject matter experts