

Question: I need help with this review please don't Google or I will give thumbs down. there are 6 parts of this question. use the notes
I need help with this review please don't Google or I will give thumbs down. there are 6 parts of this question. use the notes to answer
Questions:
Notes. FIGURE 6
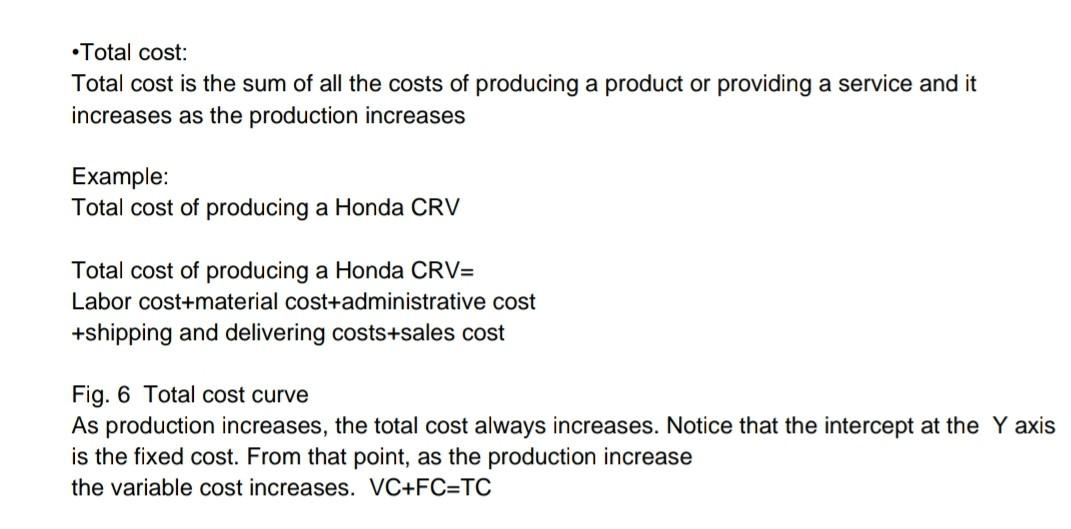
FIGURE 7
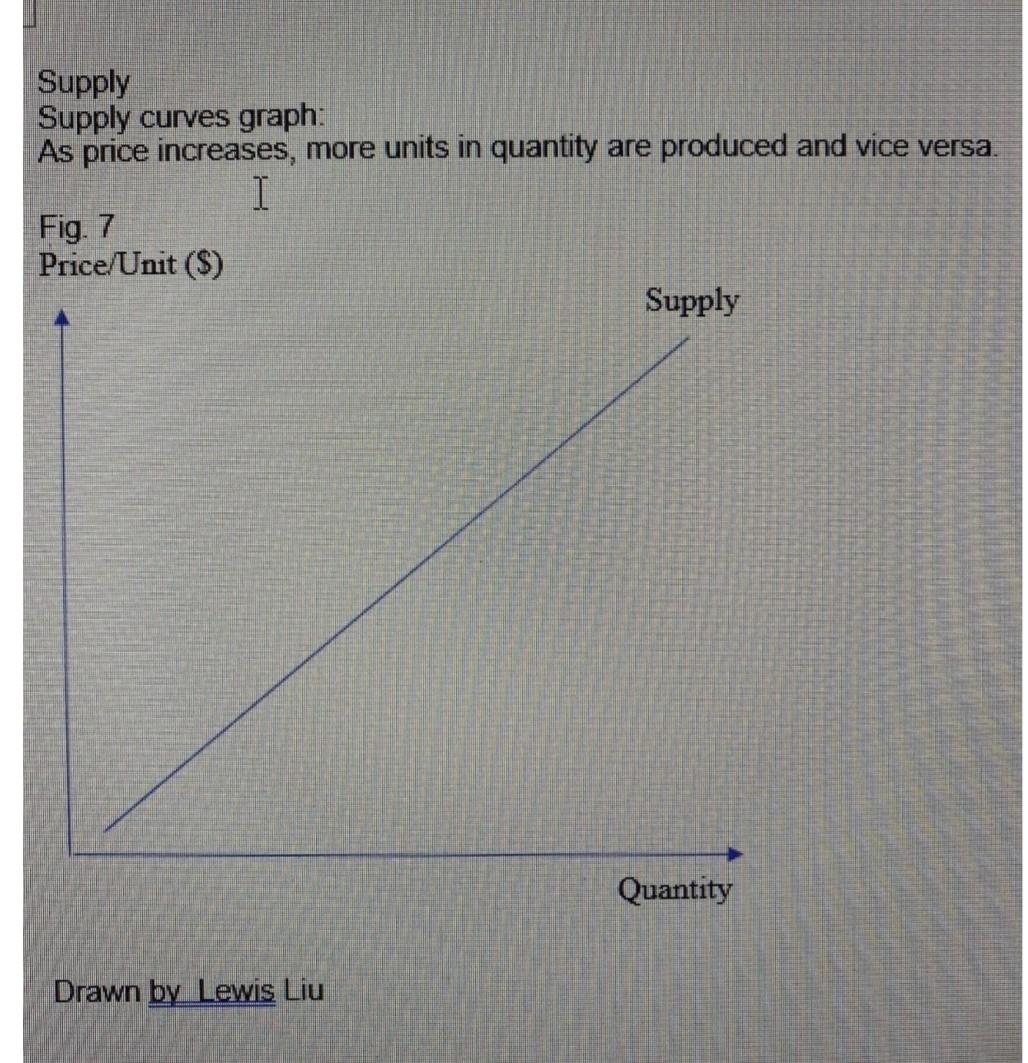
FIGURE 8
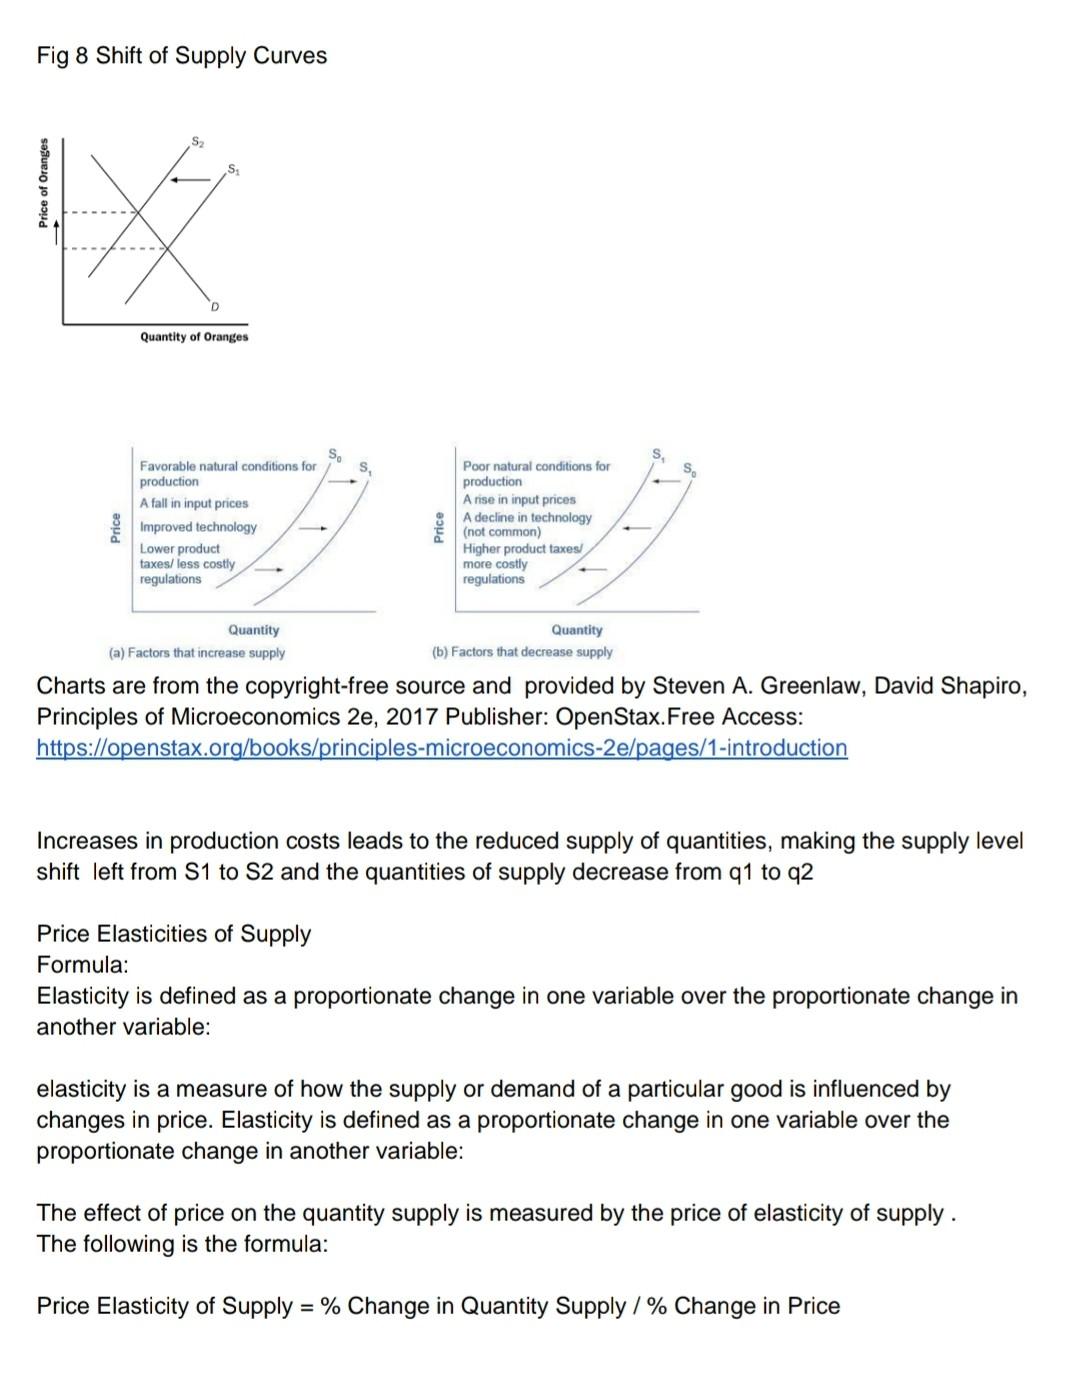
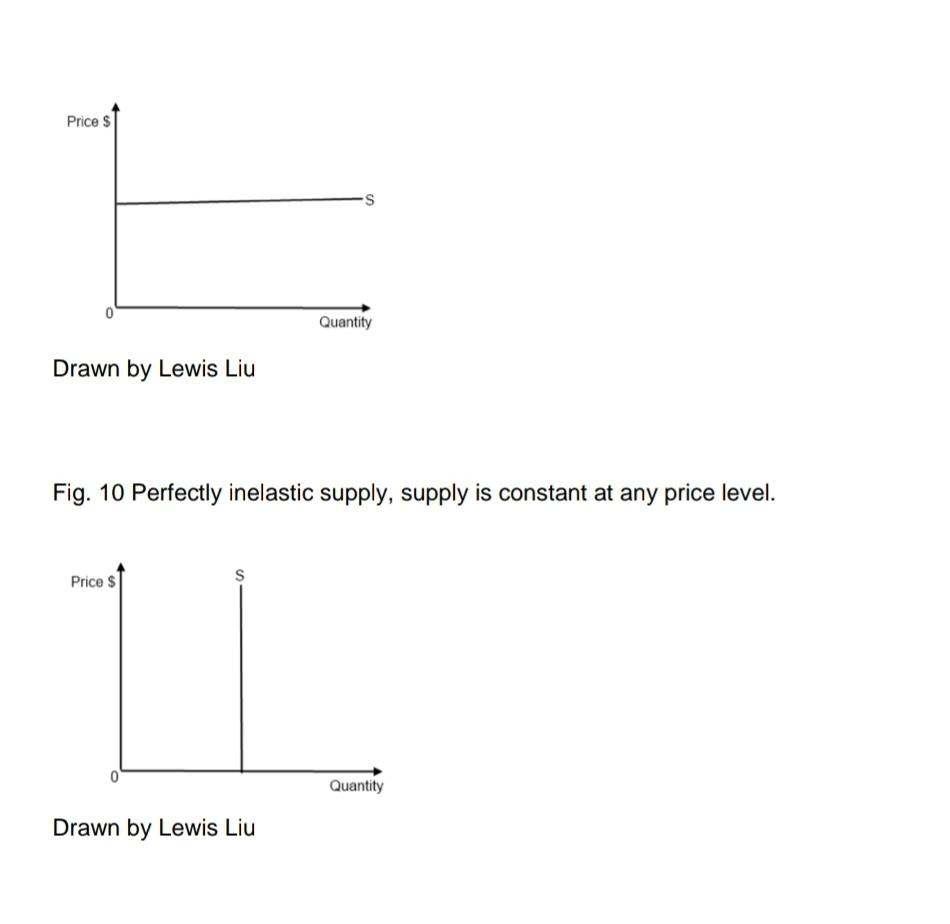
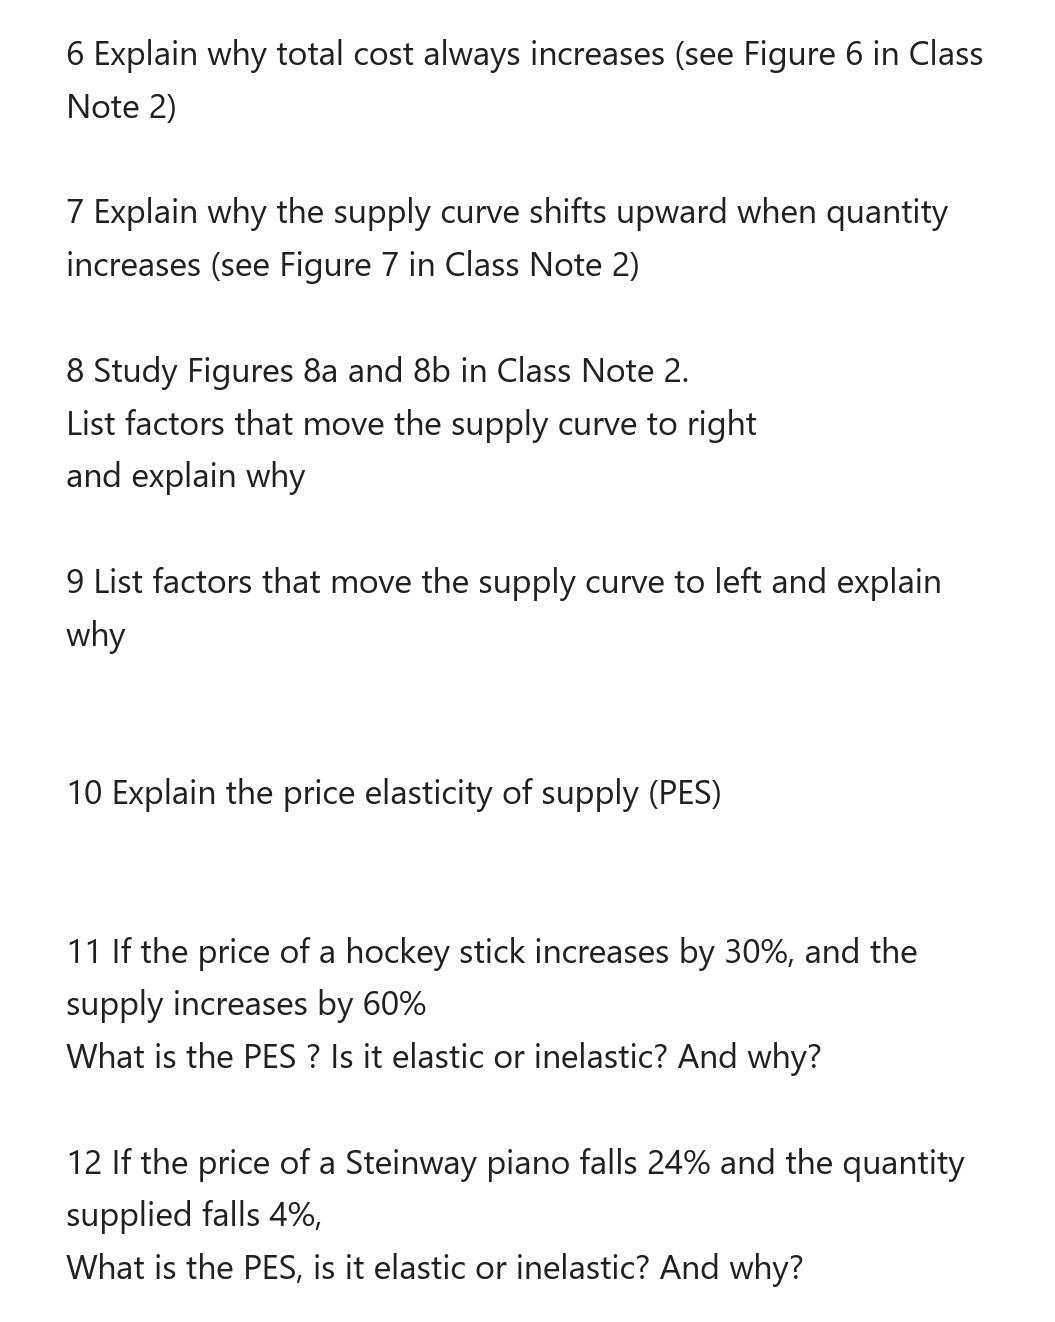
6 Explain why total cost always increases (see Figure 6 in Class Note 2) 7 Explain why the supply curve shifts upward when quantity increases (see Figure 7 in Class Note 2) 8 Study Figures 8a and 8b in Class Note 2. List factors that move the supply curve to right and explain why 9 List factors that move the supply curve to left and explain why 10 Explain the price elasticity of supply (PES) 11 If the price of a hockey stick increases by 30%, and the supply increases by 60% What is the PES ? Is it elastic or inelastic? And why? 12 If the price of a Steinway piano falls 24% and the quantity supplied falls 4%, What is the PES, is it elastic or inelastic? And why? Total cost: Total cost is the sum of all the costs of producing a product or providing a service and it increases as the production increases Example: Total cost of producing a Honda CRV Total cost of producing a Honda CRV= Labor cost+material cost+administrative cost +shipping and delivering costs+sales cost Fig. 6 Total cost curve As production increases, the total cost always increases. Notice that the intercept at the Y axis is the fixed cost. From that point, as the production increase the variable cost increases. VC+FC=TC -Total cost: Total cost is the sum of all the costs of producing a product or providing a service and it increases as the production increases . Example:Total cost of producing a Honda Total cost of producing a Honda Labor costumaterial cost+administrative cost shipping and delivering coststsales cost Fig. 6 Total cost curve As production increases, the total cost always increases $ TC Output Drawn by Lewis Liu An Additional example of Cost for training students is presented in Kingma's textbook where FC=instructor's salary+equipment and room =$1,000+5000 VC=software and supplies cost for each student AC= MC= at various output levels See Kingma: 2001, p 13. Opportunity costs The highest value of alternative opportunities forgone by consuming a good or service Examples: -A graduate student goes to school instead of working fulltime -A highly paid scientist reads a journal article as opposed to working in the lab A wait for a journal article to be delivered via interlibrary loan Research shows in SUNY that opportunity Cost to patrons of waiting for delivery was $2.60 First copy cost=fixed cost of producing A book, journal, or other piece of information before it is reproduced for distribution -Sunk costs are expenditures incurred that cannot be recovered They are irrelevant for decision making Supply Fig. 7 shows a supply curve graph: As price increases, more units in quantity are produced and vice versa. Supply Supply curves graph: As price increases, more units in quantity are produced and vice versa. I Fig. 7 Price/Unit ($) Supply Quantity Drawn by Lewis Liu Fig & Shift of Supply Curves S2 D Quantity of Oranges S. S S Favorable natural conditions for production A fall in input prices Improved technology Price Poor natural conditions for production A rise in input prices A decline in technology (not common) Higher product taxes more costly regulations Lower product taxes/less costly regulations Quantity (a) Factors that increase supply Quantity (b) Factors that decrease supply Charts are from the copyright-free source and provided by Steven A. Greenlaw, David Shapiro, Principles of Microeconomics 2e, 2017 Publisher: OpenStax.Free Access: https://openstax.org/books/principles-microeconomics-2e/pages/1-introduction Increases in production costs leads to the reduced supply of quantities, making the supply level shift left from S1 to S2 and the quantities of supply decrease from 91 to 92 Price Elasticities of Supply Formula: Elasticity is defined as a proportionate change in one variable over the proportionate change in another variable: elasticity is a measure of how the supply or demand of a particular good is influenced by changes in price. Elasticity is defined as a proportionate change in one variable over the proportionate change in another variable: The effect of price on the quantity supply is measured by the price of elasticity of supply. The following is the formula: Price Elasticity of Supply = % Change in Quantity Supply / % Change in Price Price $ -S 0 Quantity Drawn by Lewis Liu Fig. 10 Perfectly inelastic supply, supply is constant at any price level. Price $ S Quantity Drawn by Lewis Liu
Step by Step Solution
There are 3 Steps involved in it
1 Expert Approved Answer
Step: 1 Unlock

Question Has Been Solved by an Expert!
Get step-by-step solutions from verified subject matter experts
Step: 2 Unlock
Step: 3 Unlock