

Question: I need help with this stats question: Homework6: Problem 1 (1 point) Willam E. Pelham et aI. studied the how different levels of Ritalin and


I need help with this stats question:
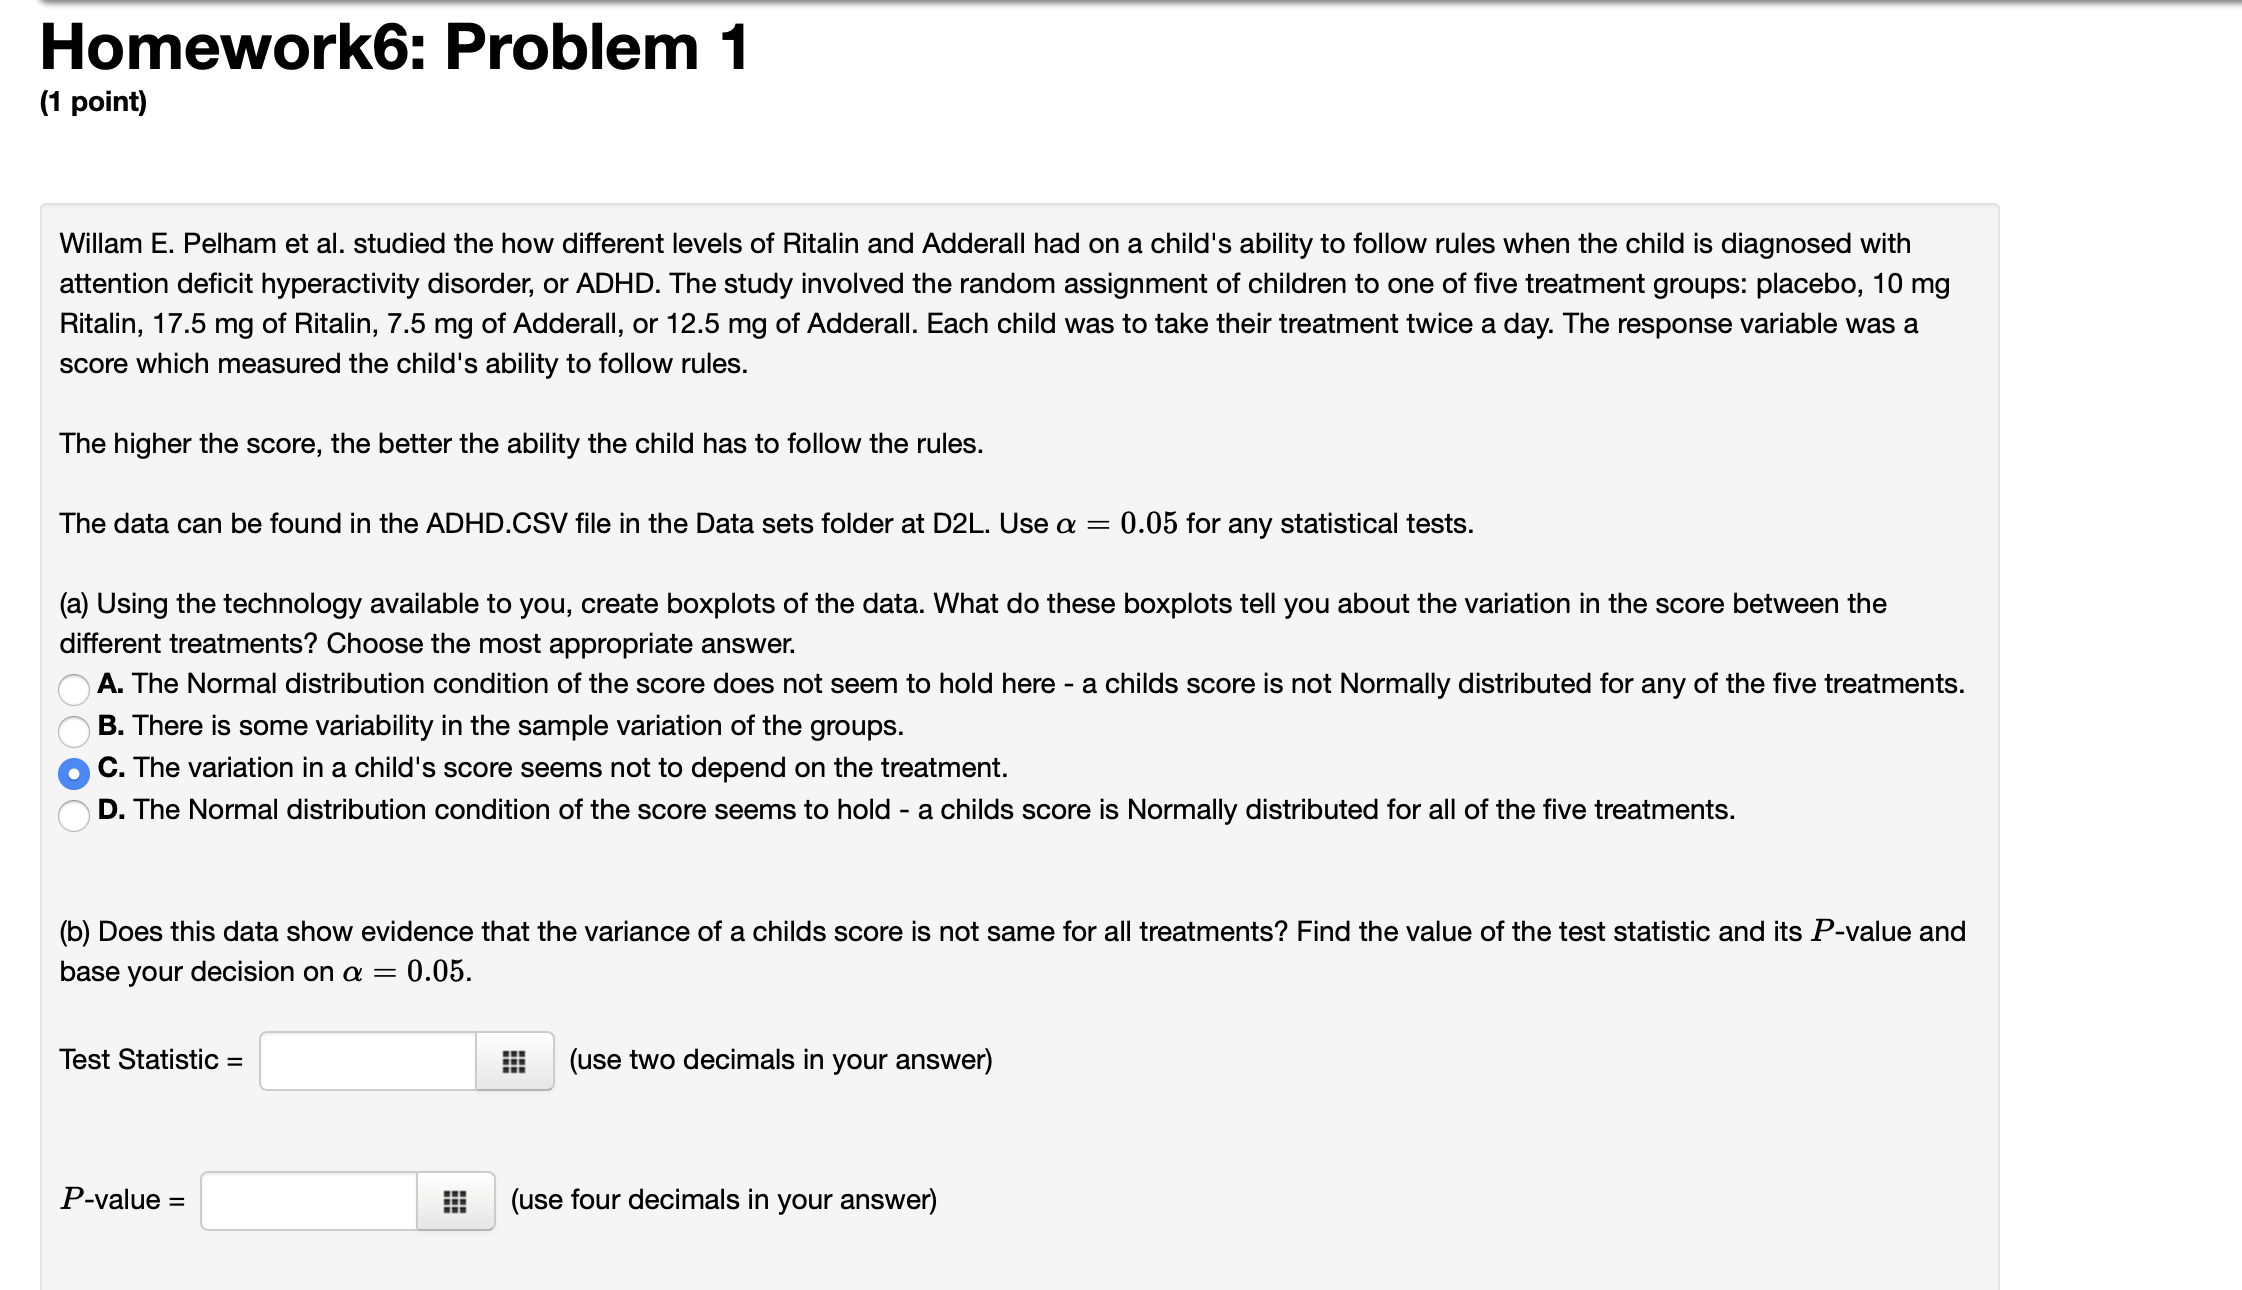
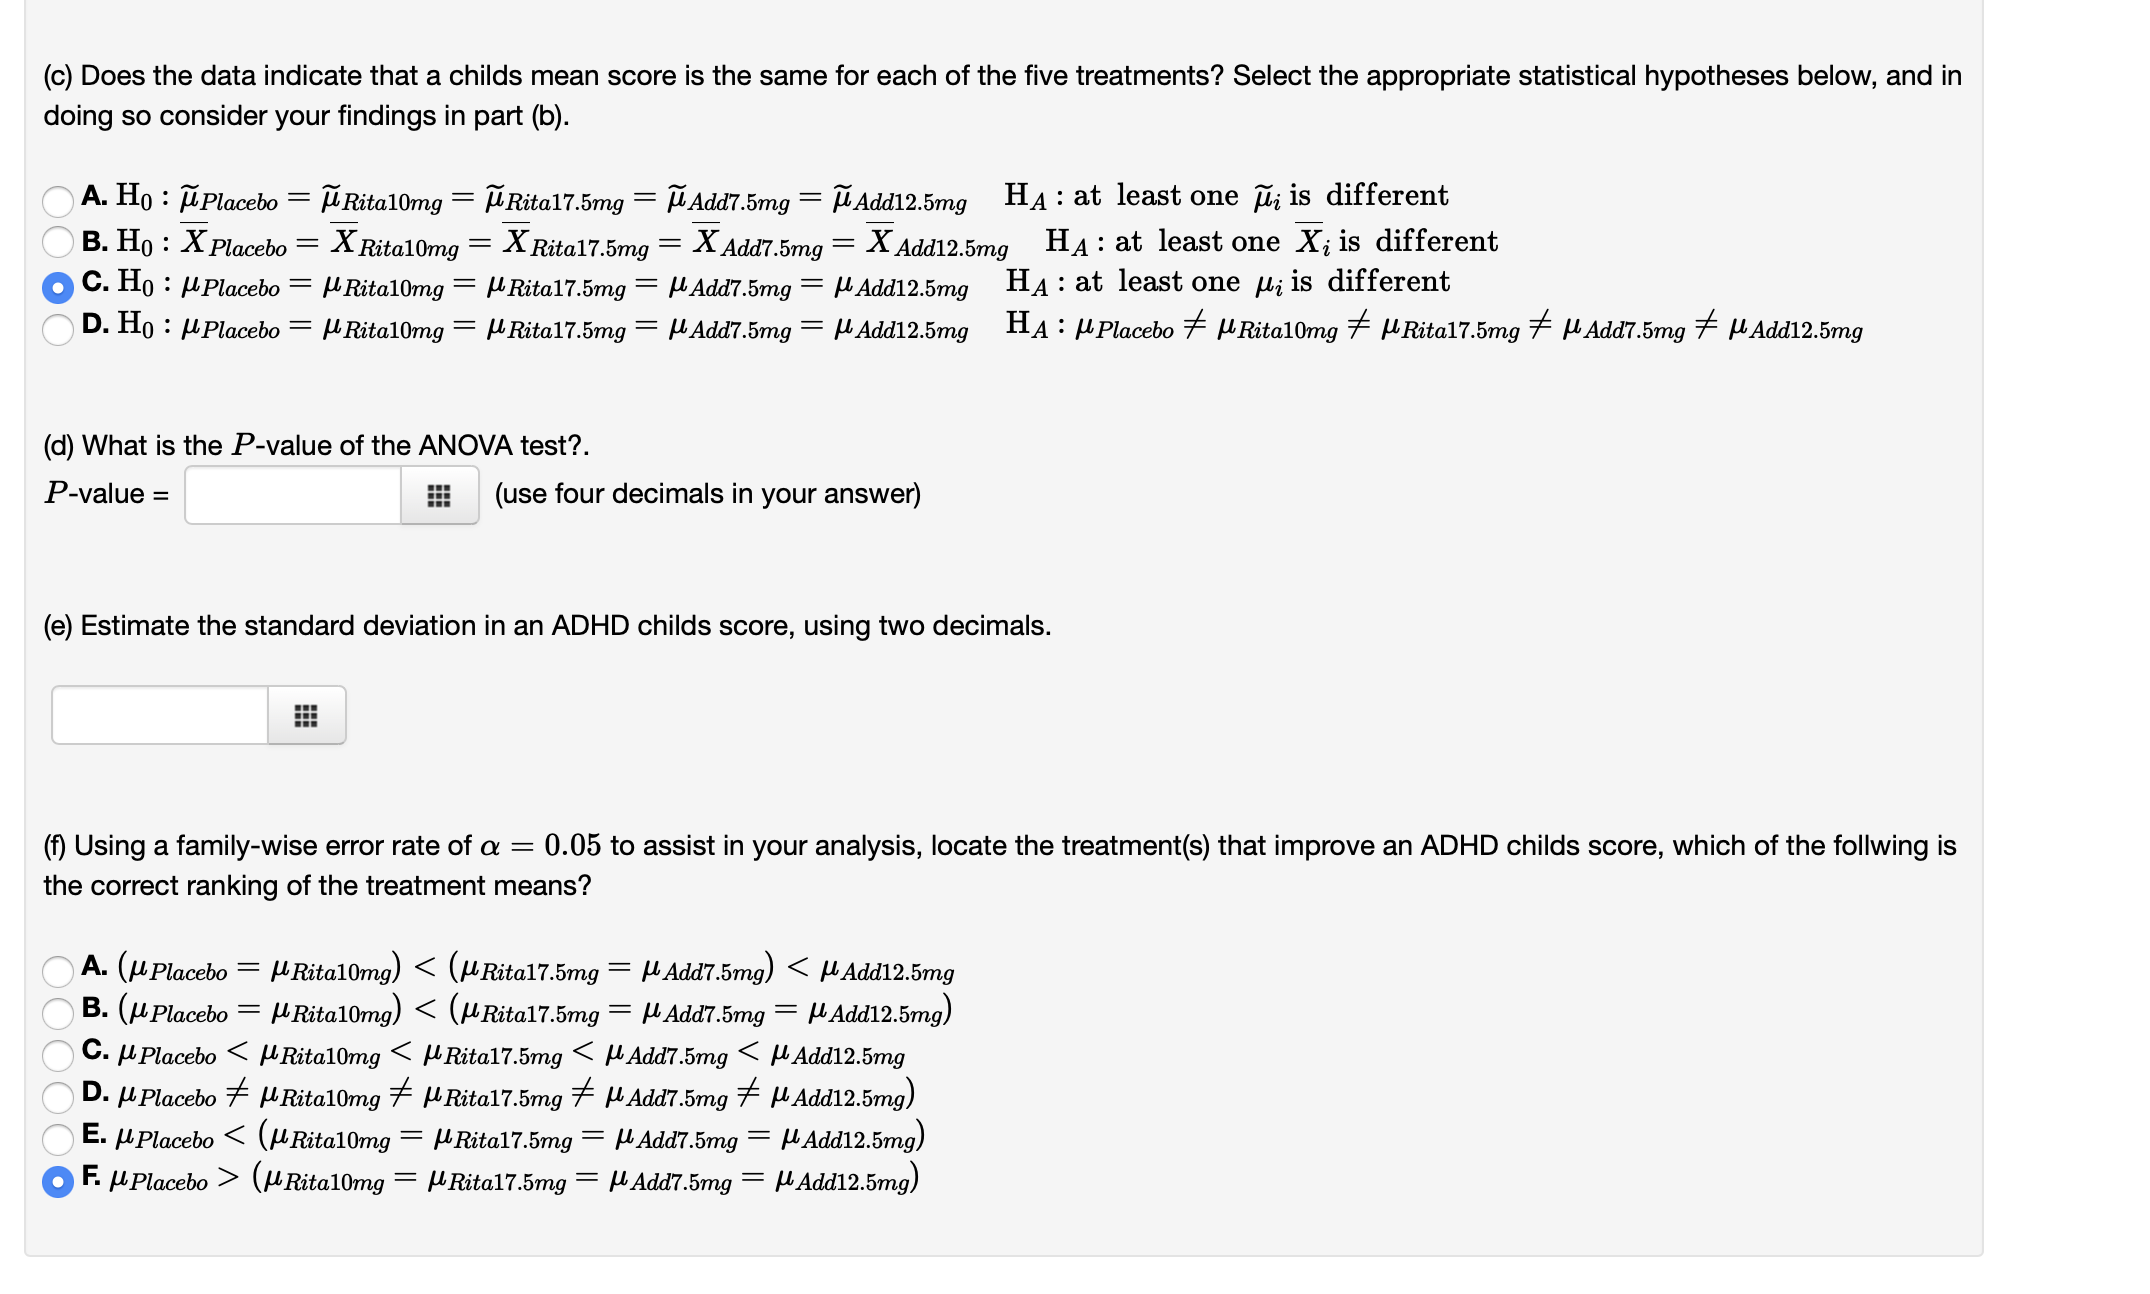
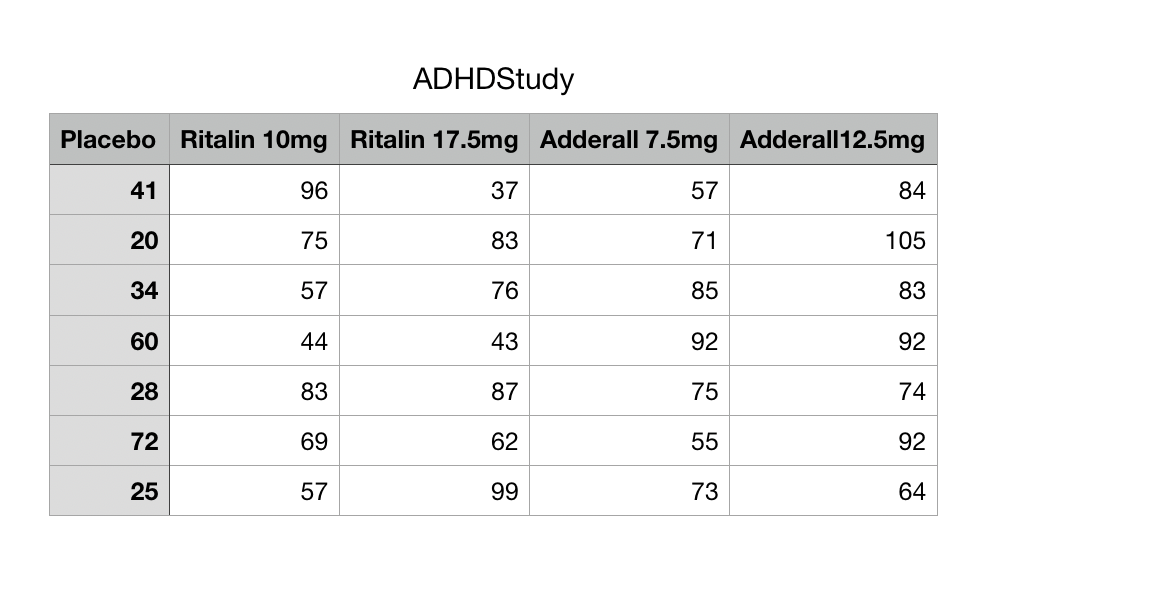
Homework6: Problem 1 (1 point) Willam E. Pelham et aI. studied the how different levels of Ritalin and Adderall had on a child's ability to follow rules when the child is diagnosed with attention deficit hyperactivity disorder, or ADHD. The study involved the random assignment of children to one of five treatment groups: placebo, 10 mg Ritalin, 17.5 mg of Ritalin, 7.5 mg of Adderall, or 12.5 mg of Adderall. Each child was to take their treatment twice a day. The response variable was a score which measured the child's ability to follow rules. The higher the score, the better the ability the child has to follow the rules. The data can be found in the ADHD.CSV file in the Data sets folder at D2L. Use a = 0.05 for any statistical tests. (a) Using the technology available to you, create boxplots of the data. What do these boxplots tell you about the variation in the score between the different treatments? Choose the most appropriate answer. .A. A. The Normal distribution condition of the score does not seem to hold here - a childs score is not Normally distributed for any of the five treatments. A B. There is some variability in the sample variation of the groups. 0 c. The variation in a child's score seems not to depend on the treatment. .A. D. The Normal distribution condition of the score seems to hold - a childs score is Normally distributed for all of the five treatments. (b) Does this data show evidence that the variance of a childs score is not same for all treatments? Find the value of the test statistic and its P-value and base your decision on a = 0.05. Test Statistic = E (use two decimals in your answer) P-value = E (use four decimals in your answer) (c) Does the data indicate that a childs mean score is the same for each of the five treatments? Select the appropriate statistical hypotheses below, and in doing so consider your findings in part (b). A. Ho : Placebo = M Ritalong = M Rita17.5mg = M Add7.5mg = M Add12.5mg HA : at least one pi is different B. Ho : X Placebo = X Ritalong = X Rita17.5mg = X Add7.5mg = X Add12.5mg HA : at least one Xi is different C. Ho : MPlacebo = / Ritalong = M Rita17.5mg = M. Add7.5mg = M Add12.5mg HA : at least one Mi is different OD. Ho : M Placebo = M Ritalong = M Rita17.5mg = M Add7.5mg = M Add12.5mg HA : M Placebo # MRitalong # M Rita17.5mg # M Add7.5mg # M Add12.5mg (d) What is the P-value of the ANOVA test?. P-value = (use four decimals in your answer) (e) Estimate the standard deviation in an ADHD childs score, using two decimals. (f) Using a family-wise error rate of a = 0.05 to assist in your analysis, locate the treatment(s) that improve an ADHD childs score, which of the follwing is the correct ranking of the treatment means? A. (M Placebo = MRitalomg) (MRita10mg = M Rita17.5mg = M Add7.5mg = MAdd12.5mg)
Step by Step Solution
There are 3 Steps involved in it

Get step-by-step solutions from verified subject matter experts