

Question: I need help with this two questions please I have the 2 histogram just need help answer the 2 questions please. Prompt In your initial
I need help with this two questions please I have the 2 histogram just need help answer the 2 questions please.
Prompt
In your initial discussion post, respond to each of the following after you download the drinking.xlsx file provided in the Data section below.
- Describe the distribution of weekly alcohol consumption using concepts from Unit 2.
- Make an appropriate graph and provide appropriate numerical summaries. To recall how to create these items, see the StatCrunch directions provided below.
- Describe the shape, center and spread using numerical measures that best describe the distribution.
- In your description, include an interval of typical values and a discussion of variability.
- Embed your StatCrunch graph in your initial post. To recall how to embed StatCrunch output, see the directions provided below.
- Do the data suggest that drinking is a problem in this university?
- Use the data to support your answer.
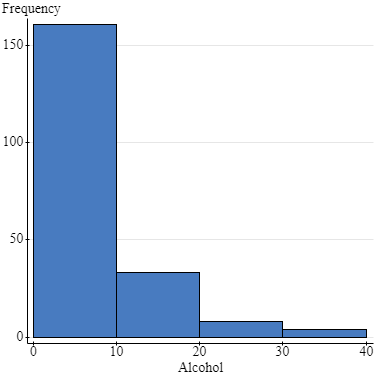
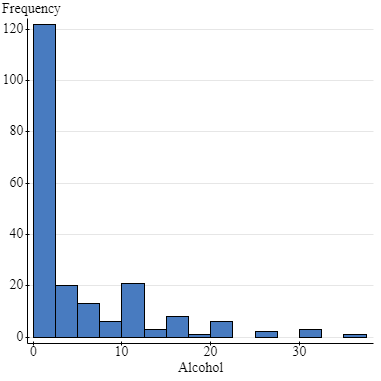
Frequency 150 100 50 10 30 40 20 Alcohol Frequency 1201 100 80 60 40 20 10 30 20 Alcohol Frequency 150 100 50 10 30 40 20 Alcohol Frequency 1201 100 80 60 40 20 10 30 20 Alcohol
Step by Step Solution
There are 3 Steps involved in it
1 Expert Approved Answer
Step: 1 Unlock

Question Has Been Solved by an Expert!
Get step-by-step solutions from verified subject matter experts
Step: 2 Unlock
Step: 3 Unlock