

Question: I NEED HELP WITH THIS...PLEASE.....The data file he references is attached...please help...thank you Quarterly sales growth forNetflixis in the following data set (link):Netflix_growth_pct.xlsx a).Use Excel
I NEED HELP WITH THIS...PLEASE.....The data file he references is attached...please help...thank you
Quarterly sales growth forNetflixis in the following data set (link):Netflix_growth_pct.xlsx
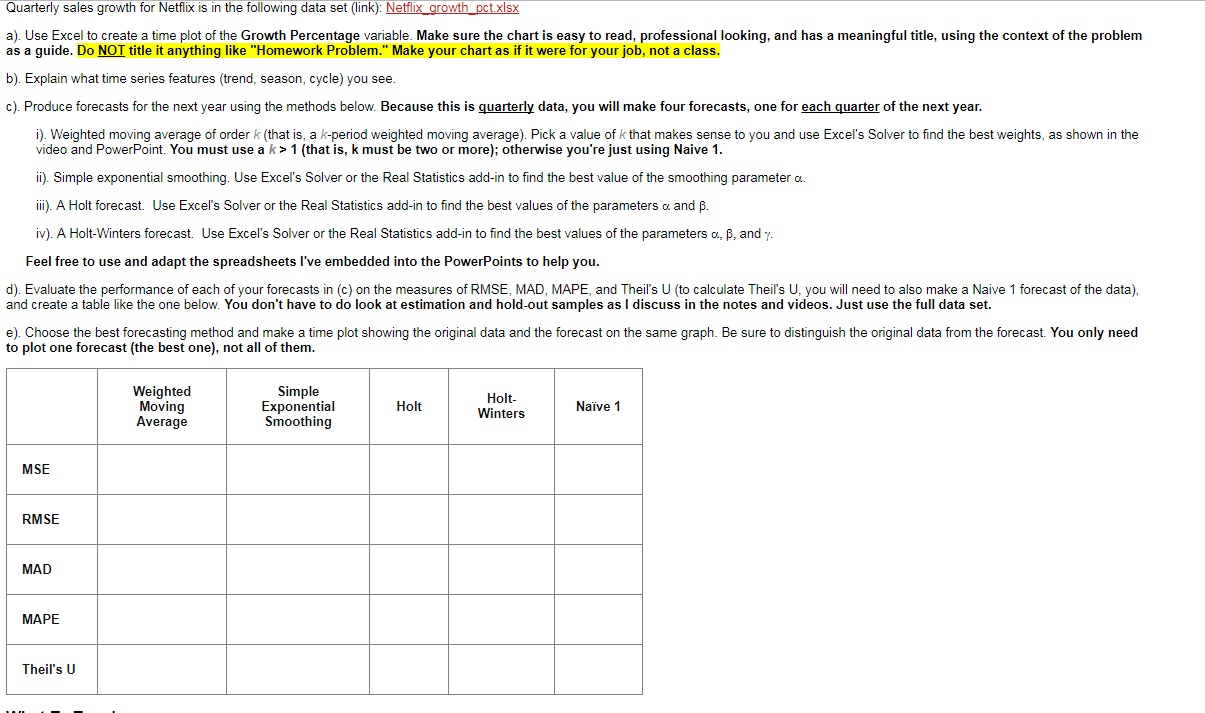
a).Use Excel to time plot of theGrowth Percentagevariable.Make sure the chart is easy to read, professional looking, and has a meaningful title, using the context of the problem as a guide.DoNOTtitle it anything like "Homework Problem." Make your chart as if it were for your job, not a class.
b). Explain what time series features (trend, season, cycle) you see.
c). Produce forecasts for the next year using the methods below.Because this isquarterlydata, you will make four forecasts, one foreach quarterof the next year.
i). Weighted moving average of orderk(that is, ak-period weighted moving average).Pick a value ofkthat makes sense to you and useExcel'sSolver to find the best weights, as shown in the video andPowerPoint.You must use ak> 1 (that is, k must be two or more); otherwise you're just using Naive 1.
ii). Simple exponential smoothing. UseExcel'sSolver or the Real Statistics add-in to find the best value of the smoothing parametera.
iii). A Holt forecast.UseExcel'sSolver or theReal Statistics add-in to find the best values of the parametersaandb.
iv). A Holt-Winters forecast.UseExcel'sSolver or theReal Statistics add-in to find the best values of the parametersa,b,andg.
Feel free to use and adaptthe spreadsheets I've embedded into thePowerPointsto help you.
d). Evaluate the performance of each of your forecasts in (c) on the measures of RMSE, MAD, MAPE, andTheil'sU (tocalculateTheil'sU,you will need to also make a Naive 1 forecast of the data), and table like the one below.You don't have to do look at estimation and hold-out samples as I discuss in the notes and videos. Just use the full data set.
e). Choose the best forecasting method and make a time plot showing the original data and the forecast on the same graph. Be sure to distinguish the original data from the forecast.You only need to plot one forecast (the best one), not all of them.
Weighted Moving AverageSimple Exponential SmoothingHoltHolt-WintersNave1MSERMSEMADMAPETheil'sU
What ToTurn In
- Submit one (1)Excel file with the following items:
- spreadsheet with the data
- Your time plot (you can have it in the same worksheet as the data if you want)
- Your answers to parts b, c, d, and e above. You can write directly into the Excel worksheet or make a text box and answers in there.
\fGrowth -percentag Year Quarter e 2001 1 27.4 2001 2 7.6 2001 3 2.8 2001 4 14.5 2002 1 41.2 2002 2 19.1 2002 3 12.0 2002 4 10.9 2003 1 23.2 2003 2 13.5 2003 3 14.3 2003 4 12.4 2004 1 22.9 2004 2 19.9 2004 3 17.3 2004 4 0.2 2005 1 8.4 2005 2 7.6 2005 3 5.3 2005 4 11.7 2006 1 16.1 2006 2 6.8 2006 3 6.9 2006 4 8.3 2007 1 10.1 2007 2 -0.5 2007 3 -3.2 2007 4 2.9 2008 1 7.9 2008 2 3.5 2008 3 1.1 2008 4 5.5 2009 1 9.5 2009 2 3.7 2009 3 3.6 2009 4 5.0
Step by Step Solution
There are 3 Steps involved in it

Get step-by-step solutions from verified subject matter experts