

Question: I need help with understanding the conclusion to know what is going on. and are the numbers correct? Mini Case Study Spreadsheet Exercise: Chapter 3
 I need help with understanding the conclusion to know what is going on. and are the numbers correct?
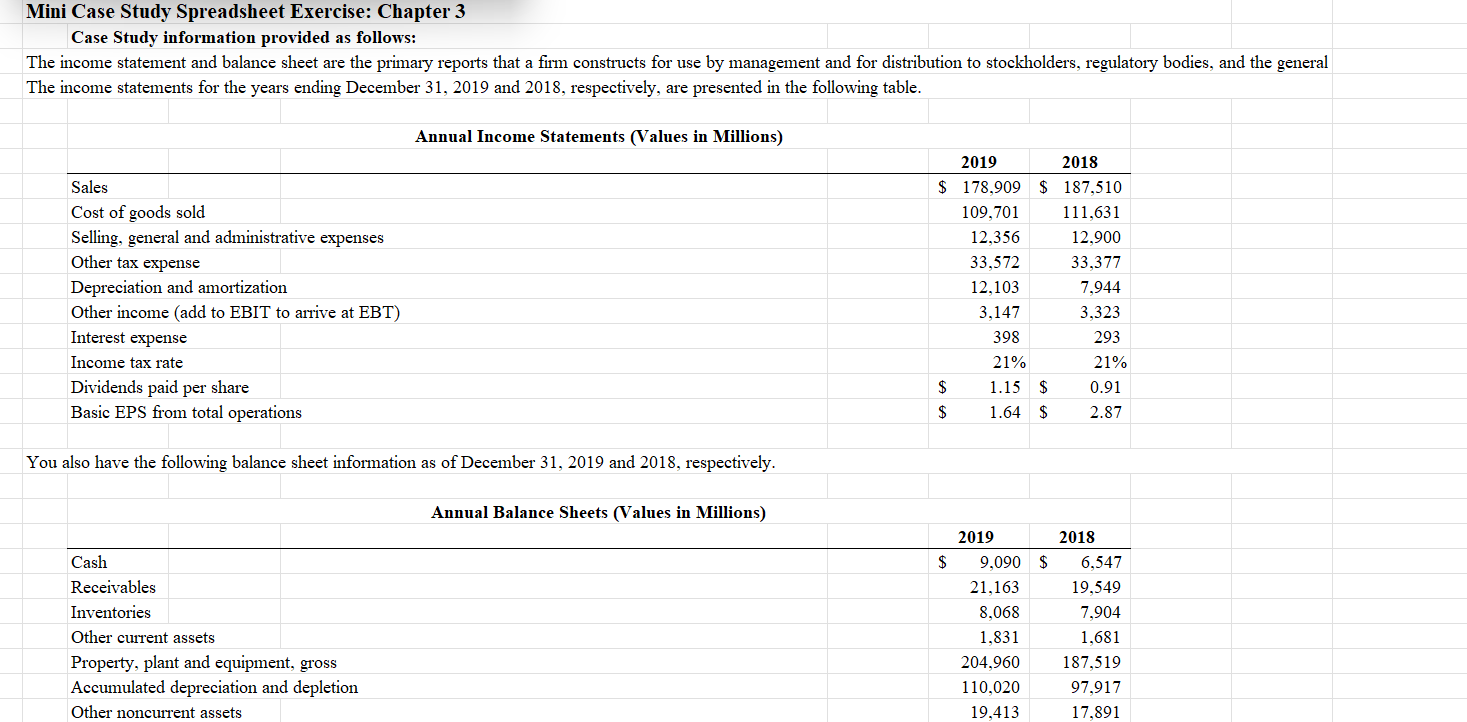
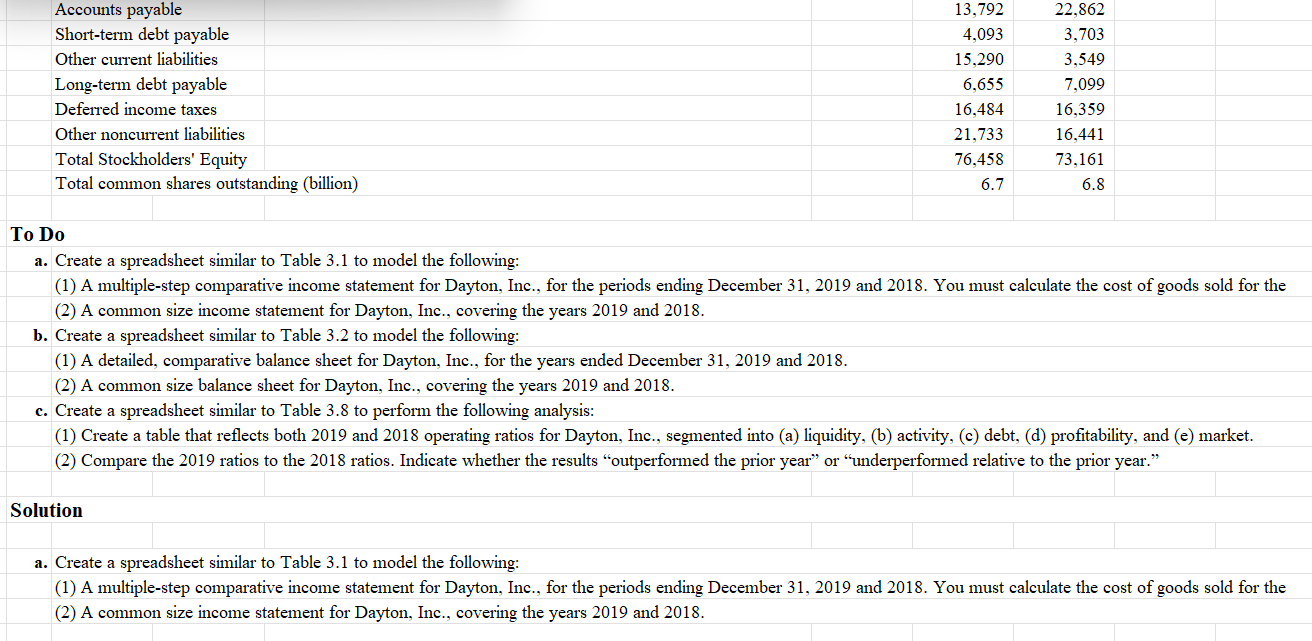
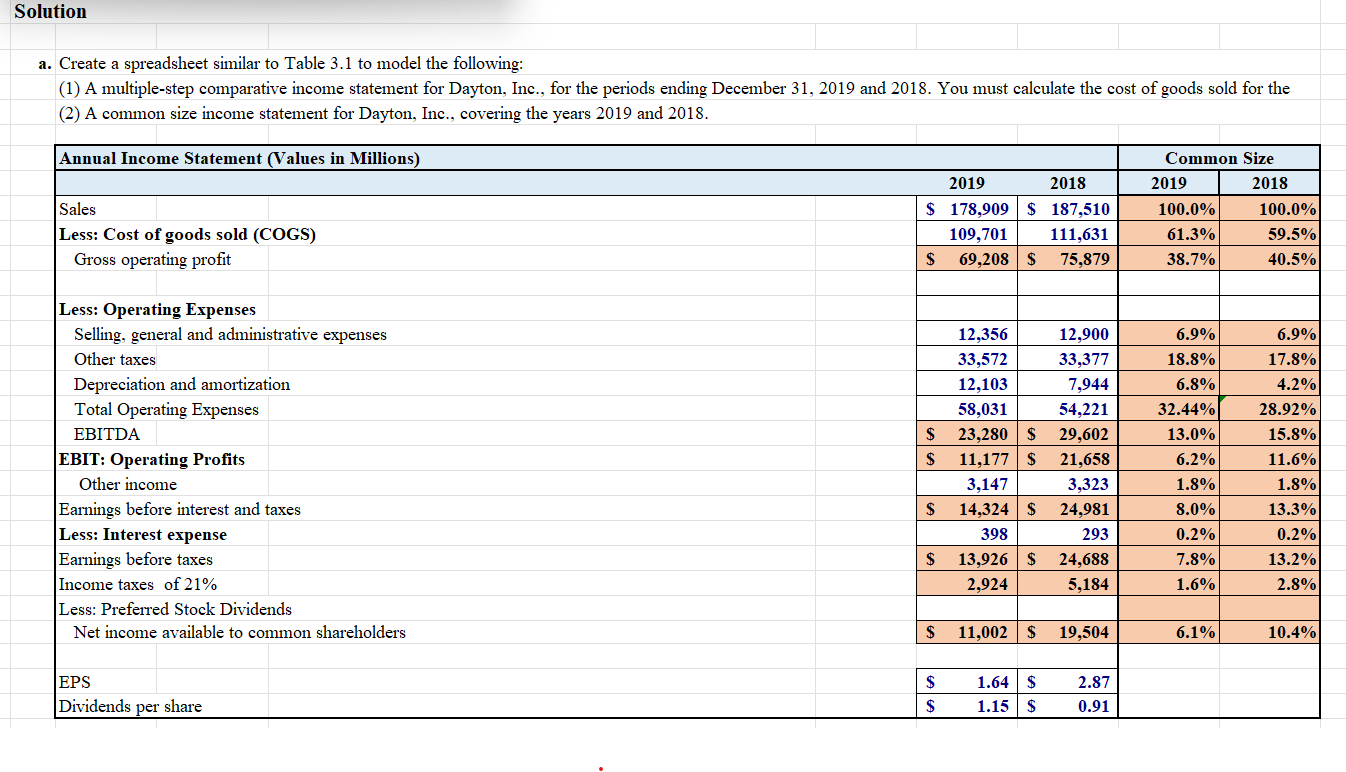
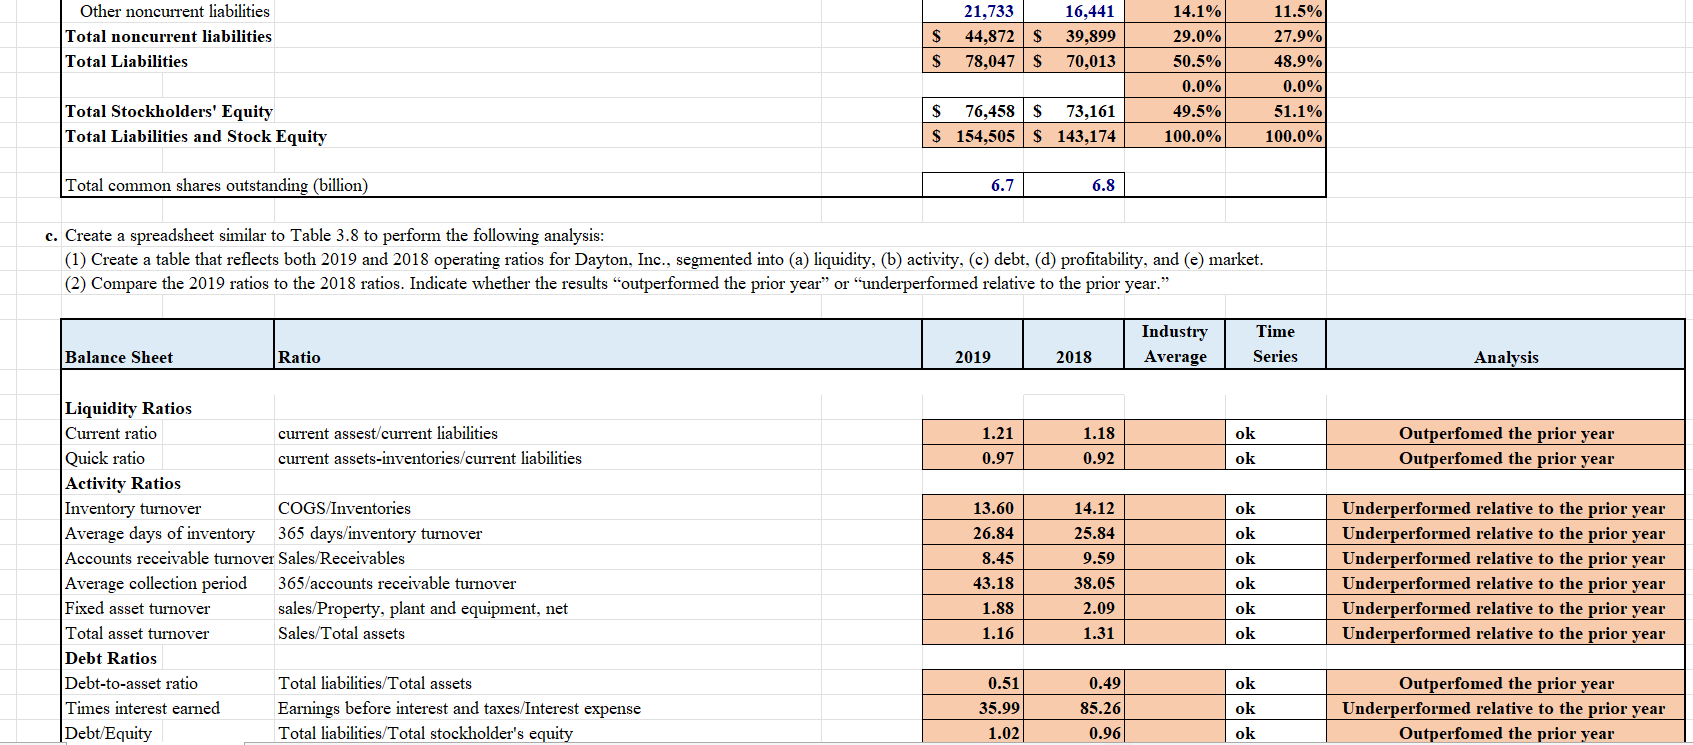
Mini Case Study Spreadsheet Exercise: Chapter 3 Case Study information provided as follows: The income statement and balance sheet are the primary reports that a firm constructs for use by management and for distribution to stockholders, regulatory bodies, and the general The income statements for the years ending December 31, 2019 and 2018, respectively, are presented in the following table. Annual Income Statements (Values in Millions) Sales Cost of goods sold Selling, general and administrative expenses Other tax expense Depreciation and amortization Other income (add to EBIT to arrive at EBT) Interest expense Income tax rate Dividends paid per share Basic EPS from total operations 2019 2018 $ 178,909 $ 187,510 109,701 111,631 12,356 12.900 33,572 33,377 12,103 7,944 3,147 3,323 398 293 21% 21% $ 1.15 $ 0.91 $ 1.64 $ 2.87 You also have the following balance sheet information as of December 31, 2019 and respectively. Annual Balance Sheets (Values in Millions) $ Cash Receivables Inventories Other current assets Property, plant and equipment, gross Accumulated depreciation and depletion Other noncurrent assets 2019 9.090 $ 21,163 8,068 1,831 204,960 110,020 19,413 2018 6,547 19,549 7,904 1,681 187,519 97,917 17.891 Accounts payable Short-term debt payable Other current liabilities Long-term debt payable Deferred income taxes Other noncurrent liabilities Total Stockholders' Equity Total common shares outstanding (billion) 13,792 4,093 15,290 6,655 16,484 21,733 76,458 6.7 22,862 3,703 3,549 7,099 16,359 16,441 73,161 6.8 To Do a. Create a spreadsheet similar to Table 3.1 to model the following: (1) A multiple-step comparative income statement for Dayton, Inc., for the periods ending December 31, 2019 and 2018. You must calculate the cost of goods sold for the (2) A common size income statement for Dayton, Inc., covering the years 2019 and 2018. b. Create a spreadsheet similar to Table 3.2 to model the following: (1) A detailed, comparative balance sheet for Dayton, Inc., for the years ended December 31, 2019 and 2018. (2) A common size balance sheet for Dayton, Inc., covering the years 2019 and 2018. c. Create a spreadsheet similar to Table 3.8 to perform the following analysis: (1) Create a table that reflects both 2019 and 2018 operating ratios for Dayton, Inc., segmented into (a) liquidity, (b) activity, (c) debt, (d) profitability, and (e) market. (2) Compare the 2019 ratios to the 2018 ratios. Indicate whether the results "outperformed the prior year or underperformed relative to the prior year." Solution a. Create a spreadsheet similar to Table 3.1 to model the following: (1) A multiple-step comparative income statement for Dayton, Inc., for the periods ending December 31, 2019 and 2018. You must calculate the cost of goods sold for the (2) A common size income statement for Dayton, Inc., covering the years 2019 and 2018. Solution a. Create a spreadsheet similar to Table 3.1 to model the following: (1) A multiple-step comparative income statement for Dayton, Inc., for the periods ending December 31, 2019 and 2018. You must calculate the cost of goods sold for the (2) A common size income statement for Dayton, Inc., covering the years 2019 and 2018. Annual Income Statement (Values in Millions) Sales Less: Cost of goods sold (COGS) Gross operating profit 2019 2018 $ 178,909 $ 187,510 109,701 111,631 $ 69,208 $ 75,879 Common Size 2019 2018 100.0% 100.0% 61.3% 59.5% 38.7% 40.5% 6.9% $ $ Less: Operating Expenses Selling, general and administrative expenses Other taxes Depreciation and amortization Total Operating Expenses EBITDA EBIT: Operating Profits Other income Earnings before interest and taxes Less: Interest expense Earnings before taxes Income taxes of 21% Less: Preferred Stock Dividends Net income available to common shareholders 12,356 33,572 12,103 58,031 23,280$ 11,177 $ 3,147 14,324 $ 398 13,926 $ 2,924 12,900 33,377 7,944 54,221 29,602 21,658 3,323 24,981 293 24,688 5,184 18.8% 6.8% 32.44% 13.0% 6.2% 1.8% 8.0% 0.2% 7.8% 1.6% 6.9% 17.8% 4.2% 28.92% 15.8% 11.6% 1.8% 13.3% 0.2% 13.2% 2.8% $ $ $ 11,002 $ 19,504 6.1% 10.4% $ EPS Dividends per share wal 1.64 $ 1.15 $ 2.87 0.91 $ Other noncurrent liabilities Total noncurrent liabilities Total Liabilities $ 21,733 44,872 $ 78,047 $ 16,441 39,899 70,013 $ 14.1% 29.0% 50.5% 0.0% 49.5% 100.0% 11.5% 27.9% 48.9% 0.0% 51.1% 100.0% Total Stockholders' Equity Total Liabilities and Stock Equity $ 76,458 $ 73,161 $ 154,505 $ 143,174 Total common shares outstanding (billion) 6.7 6.8 c. Create a spreadsheet similar to Table 3.8 to perform the following analysis: (1) Create a table that reflects both 2019 and 2018 operating ratios for Dayton, Inc., segmented into (a) liquidity, (b) activity, (c) debt, (d) profitability, and (e) market. (2) Compare the 2019 ratios to the 2018 ratios. Indicate whether the results outperformed the prior year or underperformed relative to the prior year. Industry Average Time Series Balance Sheet Ratio 2019 2018 Analysis 1.21 0.97 1.18 0.92 ok ok Outperfomed the prior year Outperfomed the prior year ok ok Liquidity Ratios Current ratio current assest/current liabilities Quick ratio current assets-inventories/current liabilities Activity Ratios Inventory turnover COGS/Inventories Average days of inventory 365 days/inventory turnover Accounts receivable turnover Sales/Receivables Average collection period 365/accounts receivable turnover Fixed asset turnover sales/Property, plant and equipment, net Total asset turnover Sales/Total assets Debt Ratios Debt-to-asset ratio Total liabilities/Total assets Times interest earned Earnings before interest and taxes/Interest expense Debt/Equity Total liabilities/Total stockholder's equity 13.60 26.84 8.45 43.18 1.88 1.16 14.12 25.84 9.59 38.05 2.09 1.31 ok ok Underperformed relative to the prior year Underperformed relative to the prior year Underperformed relative to the prior year Underperformed relative to the prior year Underperformed relative to the prior year Underperformed relative to the prior year ok ok 0.51 35.99 1.02 0.49 85.26 0.96 ok ok Outperfomed the prior year Underperformed relative to the prior year Outperfomed the prior year ok Earnings before interest and taxes/Interest expense Total liabilities/Total stockholder's equity 35.99 1.02 85.26 0.96 ok ok Underperformed relative to the prior year Outperfomed the prior year ok Times interest earned Debt/Equity Profitability Ratios Gross profit margin Operating profit margin Net profit margin Return on assets (ROA) Return on equity (ROE) Market Ratios Earnings per share Price per share P/E ratio Market/Book (M/B) Ratio Gross operating profit/Sales EBIT: Operating Profits/Sales Net income available to common shareholders/Sales Net income available to common shareholders/Total Assets Net income available to common shareholders/Total Stockholders' Equity 38.68% 6.25% 6.1% 7.1% 14.4% 40.47% 11.55% 10.4% 13.6% 26.7% ok ok ok Underperformed relative to the prior year Underperformed relative to the prior year Underperformed relative to the prior year Underperformed relative to the prior year Underperformed relative to the prior year ok Equals EPS $ 1.64 $ ok Underperformed relative to the prior year $ 90 2.87 NA NA NA NA Price per share/Earnings per share 54.88 Mini Case Study Spreadsheet Exercise: Chapter 3 Case Study information provided as follows: The income statement and balance sheet are the primary reports that a firm constructs for use by management and for distribution to stockholders, regulatory bodies, and the general The income statements for the years ending December 31, 2019 and 2018, respectively, are presented in the following table. Annual Income Statements (Values in Millions) Sales Cost of goods sold Selling, general and administrative expenses Other tax expense Depreciation and amortization Other income (add to EBIT to arrive at EBT) Interest expense Income tax rate Dividends paid per share Basic EPS from total operations 2019 2018 $ 178,909 $ 187,510 109,701 111,631 12,356 12.900 33,572 33,377 12,103 7,944 3,147 3,323 398 293 21% 21% $ 1.15 $ 0.91 $ 1.64 $ 2.87 You also have the following balance sheet information as of December 31, 2019 and respectively. Annual Balance Sheets (Values in Millions) $ Cash Receivables Inventories Other current assets Property, plant and equipment, gross Accumulated depreciation and depletion Other noncurrent assets 2019 9.090 $ 21,163 8,068 1,831 204,960 110,020 19,413 2018 6,547 19,549 7,904 1,681 187,519 97,917 17.891 Accounts payable Short-term debt payable Other current liabilities Long-term debt payable Deferred income taxes Other noncurrent liabilities Total Stockholders' Equity Total common shares outstanding (billion) 13,792 4,093 15,290 6,655 16,484 21,733 76,458 6.7 22,862 3,703 3,549 7,099 16,359 16,441 73,161 6.8 To Do a. Create a spreadsheet similar to Table 3.1 to model the following: (1) A multiple-step comparative income statement for Dayton, Inc., for the periods ending December 31, 2019 and 2018. You must calculate the cost of goods sold for the (2) A common size income statement for Dayton, Inc., covering the years 2019 and 2018. b. Create a spreadsheet similar to Table 3.2 to model the following: (1) A detailed, comparative balance sheet for Dayton, Inc., for the years ended December 31, 2019 and 2018. (2) A common size balance sheet for Dayton, Inc., covering the years 2019 and 2018. c. Create a spreadsheet similar to Table 3.8 to perform the following analysis: (1) Create a table that reflects both 2019 and 2018 operating ratios for Dayton, Inc., segmented into (a) liquidity, (b) activity, (c) debt, (d) profitability, and (e) market. (2) Compare the 2019 ratios to the 2018 ratios. Indicate whether the results "outperformed the prior year or underperformed relative to the prior year." Solution a. Create a spreadsheet similar to Table 3.1 to model the following: (1) A multiple-step comparative income statement for Dayton, Inc., for the periods ending December 31, 2019 and 2018. You must calculate the cost of goods sold for the (2) A common size income statement for Dayton, Inc., covering the years 2019 and 2018. Solution a. Create a spreadsheet similar to Table 3.1 to model the following: (1) A multiple-step comparative income statement for Dayton, Inc., for the periods ending December 31, 2019 and 2018. You must calculate the cost of goods sold for the (2) A common size income statement for Dayton, Inc., covering the years 2019 and 2018. Annual Income Statement (Values in Millions) Sales Less: Cost of goods sold (COGS) Gross operating profit 2019 2018 $ 178,909 $ 187,510 109,701 111,631 $ 69,208 $ 75,879 Common Size 2019 2018 100.0% 100.0% 61.3% 59.5% 38.7% 40.5% 6.9% $ $ Less: Operating Expenses Selling, general and administrative expenses Other taxes Depreciation and amortization Total Operating Expenses EBITDA EBIT: Operating Profits Other income Earnings before interest and taxes Less: Interest expense Earnings before taxes Income taxes of 21% Less: Preferred Stock Dividends Net income available to common shareholders 12,356 33,572 12,103 58,031 23,280$ 11,177 $ 3,147 14,324 $ 398 13,926 $ 2,924 12,900 33,377 7,944 54,221 29,602 21,658 3,323 24,981 293 24,688 5,184 18.8% 6.8% 32.44% 13.0% 6.2% 1.8% 8.0% 0.2% 7.8% 1.6% 6.9% 17.8% 4.2% 28.92% 15.8% 11.6% 1.8% 13.3% 0.2% 13.2% 2.8% $ $ $ 11,002 $ 19,504 6.1% 10.4% $ EPS Dividends per share wal 1.64 $ 1.15 $ 2.87 0.91 $ Other noncurrent liabilities Total noncurrent liabilities Total Liabilities $ 21,733 44,872 $ 78,047 $ 16,441 39,899 70,013 $ 14.1% 29.0% 50.5% 0.0% 49.5% 100.0% 11.5% 27.9% 48.9% 0.0% 51.1% 100.0% Total Stockholders' Equity Total Liabilities and Stock Equity $ 76,458 $ 73,161 $ 154,505 $ 143,174 Total common shares outstanding (billion) 6.7 6.8 c. Create a spreadsheet similar to Table 3.8 to perform the following analysis: (1) Create a table that reflects both 2019 and 2018 operating ratios for Dayton, Inc., segmented into (a) liquidity, (b) activity, (c) debt, (d) profitability, and (e) market. (2) Compare the 2019 ratios to the 2018 ratios. Indicate whether the results outperformed the prior year or underperformed relative to the prior year. Industry Average Time Series Balance Sheet Ratio 2019 2018 Analysis 1.21 0.97 1.18 0.92 ok ok Outperfomed the prior year Outperfomed the prior year ok ok Liquidity Ratios Current ratio current assest/current liabilities Quick ratio current assets-inventories/current liabilities Activity Ratios Inventory turnover COGS/Inventories Average days of inventory 365 days/inventory turnover Accounts receivable turnover Sales/Receivables Average collection period 365/accounts receivable turnover Fixed asset turnover sales/Property, plant and equipment, net Total asset turnover Sales/Total assets Debt Ratios Debt-to-asset ratio Total liabilities/Total assets Times interest earned Earnings before interest and taxes/Interest expense Debt/Equity Total liabilities/Total stockholder's equity 13.60 26.84 8.45 43.18 1.88 1.16 14.12 25.84 9.59 38.05 2.09 1.31 ok ok Underperformed relative to the prior year Underperformed relative to the prior year Underperformed relative to the prior year Underperformed relative to the prior year Underperformed relative to the prior year Underperformed relative to the prior year ok ok 0.51 35.99 1.02 0.49 85.26 0.96 ok ok Outperfomed the prior year Underperformed relative to the prior year Outperfomed the prior year ok Earnings before interest and taxes/Interest expense Total liabilities/Total stockholder's equity 35.99 1.02 85.26 0.96 ok ok Underperformed relative to the prior year Outperfomed the prior year ok Times interest earned Debt/Equity Profitability Ratios Gross profit margin Operating profit margin Net profit margin Return on assets (ROA) Return on equity (ROE) Market Ratios Earnings per share Price per share P/E ratio Market/Book (M/B) Ratio Gross operating profit/Sales EBIT: Operating Profits/Sales Net income available to common shareholders/Sales Net income available to common shareholders/Total Assets Net income available to common shareholders/Total Stockholders' Equity 38.68% 6.25% 6.1% 7.1% 14.4% 40.47% 11.55% 10.4% 13.6% 26.7% ok ok ok Underperformed relative to the prior year Underperformed relative to the prior year Underperformed relative to the prior year Underperformed relative to the prior year Underperformed relative to the prior year ok Equals EPS $ 1.64 $ ok Underperformed relative to the prior year $ 90 2.87 NA NA NA NA Price per share/Earnings per share 54.88
Step by Step Solution
There are 3 Steps involved in it

Get step-by-step solutions from verified subject matter experts