

Question: I need help writing this code in PYTHON : Feature #3: Generate a graph that shows the number of deaths over years. Looking at the
I need help writing this code in PYTHON:
Feature #3: Generate a graph that shows the number of deaths over years. Looking at the graph, we can tell if the number of deaths are increasing or decreasing.
To generate a plot, make sure to add this line at the very beginning of your code:
import matplotlib.pylab as plt
Then make a list of numbers -- lets call this list dlist. Each number in the list represent total death in a year. Send the list to the graph usig this line:
plt.plot(dlist)
and finally, use this line to put it on screen: plt.show()
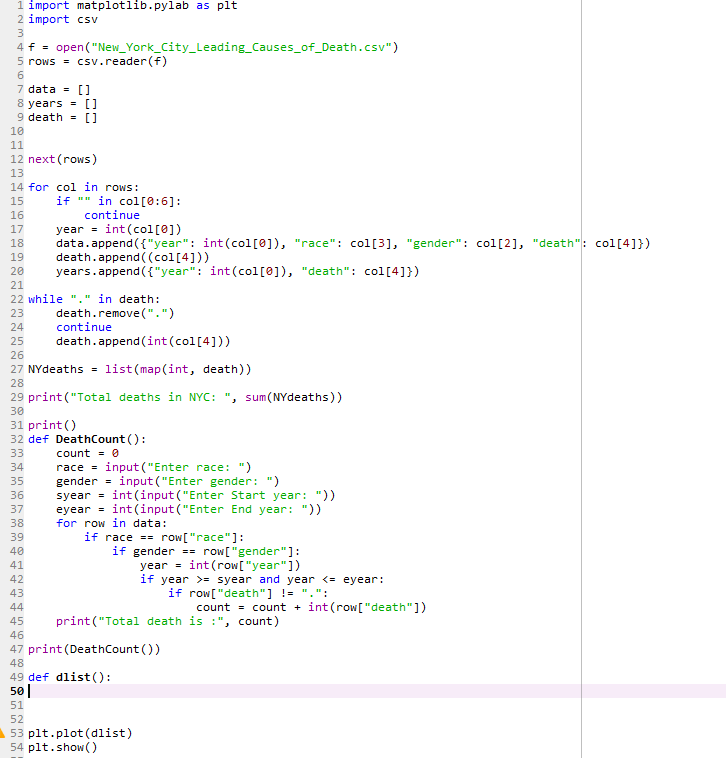
I have this code already set up for other parts of the assignment:
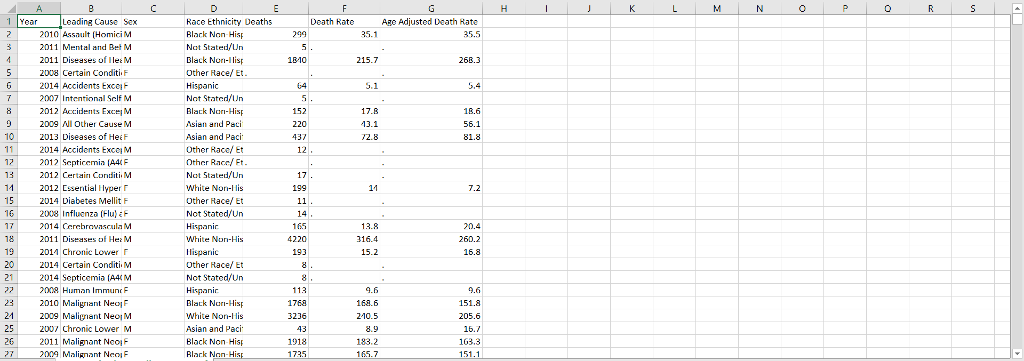
This is a screenshot of the csv file that the program is reading:
1 import matplotlib.pylab as plt 2 import csv 4 f open( "New York-City-Leading-Causes_of_death.csv") 5 rowscsv.reader(f) 7 data = [] 8 years-[] 9 death-[] 12 next (rows) 13 14 for col in rows: 15 if." "in col [0:6]: 16 17 yearint (col[01) 18 data.append ("year" int (col[e]), "race": col[3], "gender": col[2], "death": col[41) 19 death.append ( (col[4])) 20 years.append(f"year": int(col[e]), "death" col[411) 21 22 while "." in death: 23 24 25 death.append (int (col[4])) 26 27 NYdeaths- list (map(int, death)) 28 29 print ("Total deaths in NYC: ", sum(NYdeaths)) 30 31 print() 32 def DeathCount() continue death.remove(". ") continue count 0 34 race-input("Enter race:") 35 gender input("Enter gender: ") 36 syear-int(input ("Enter Start year: ")) 37 eyear-int(input("Enter End year:")) 38 39 40 forrow in data: if racerow["race"]: if genderrow[ "gender"]: yearint (row[ "year 1) if year syear and year
Step by Step Solution
There are 3 Steps involved in it

Get step-by-step solutions from verified subject matter experts