

Question: I need only problem 2, thank you Problem 2 Consider the following income statement: Rio Grande Nursing Home Inc. Statement of Income Year Ended December
I need only problem 2, thank you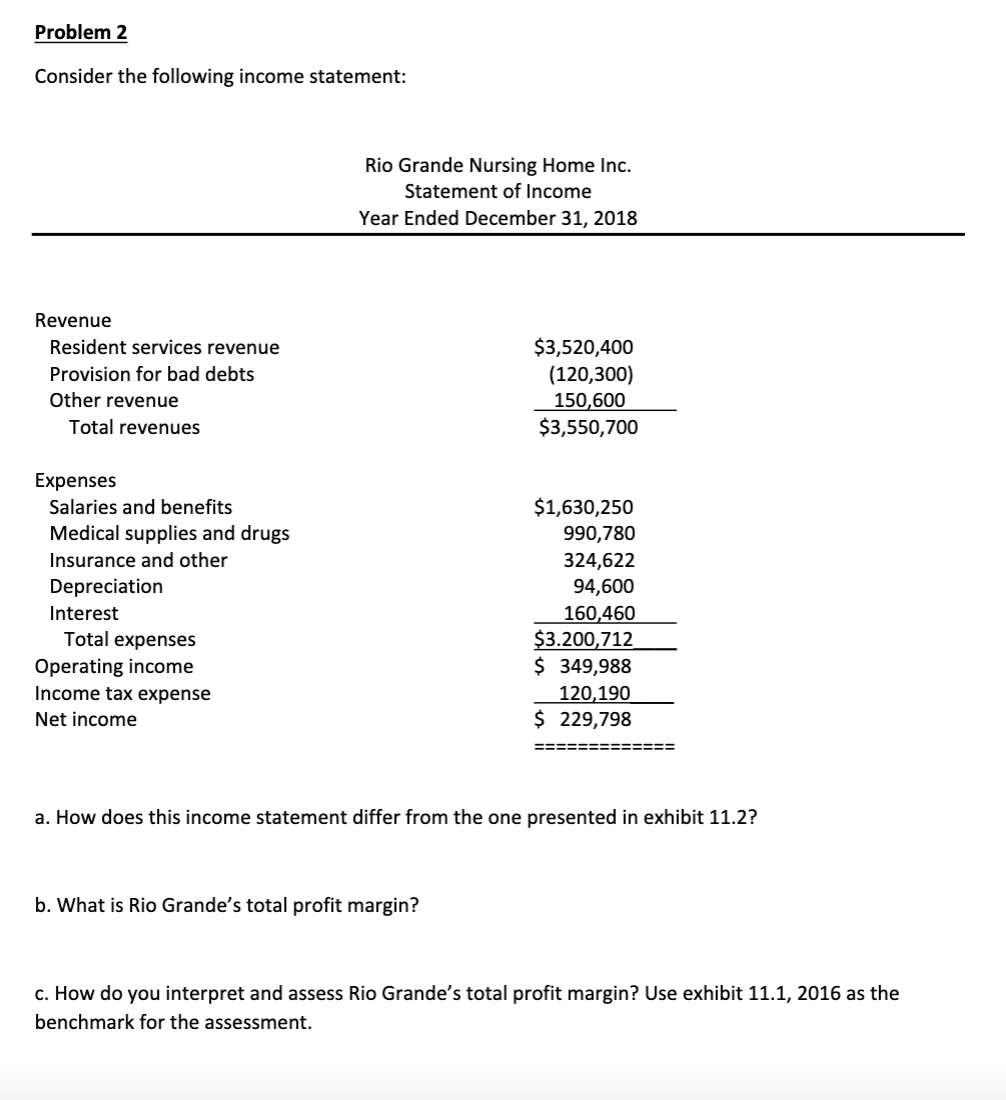
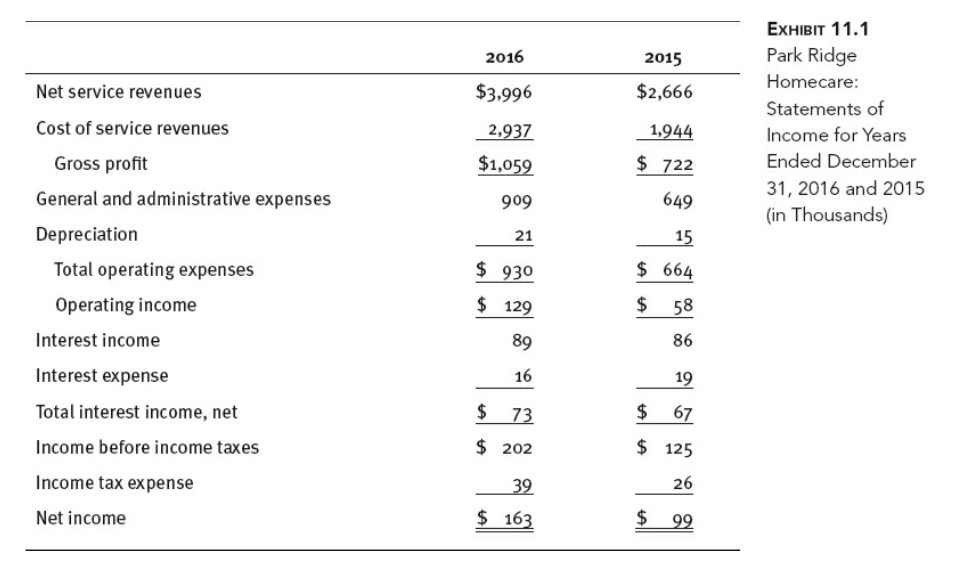
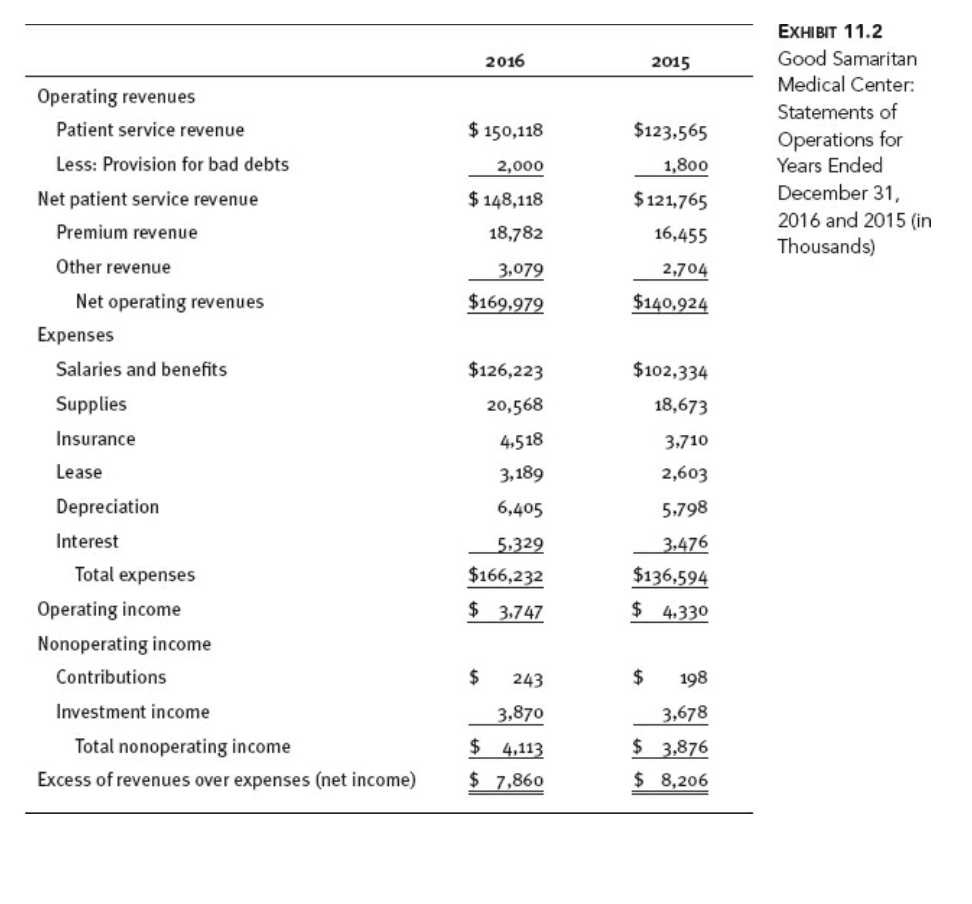
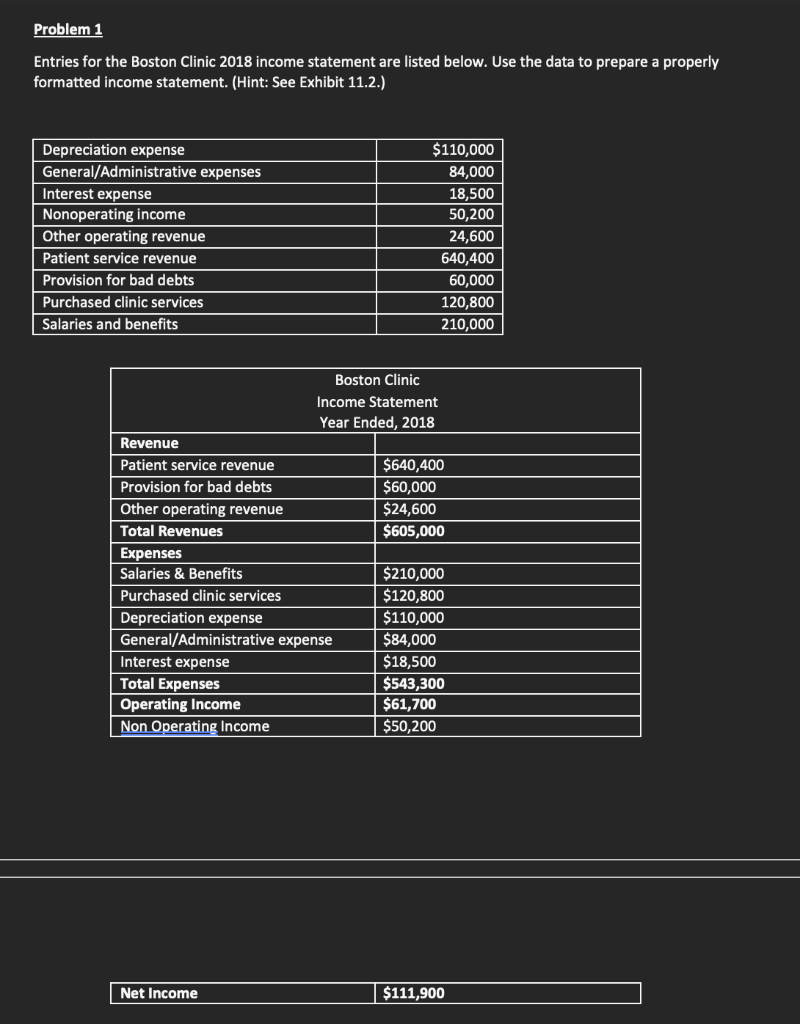
Problem 2 Consider the following income statement: Rio Grande Nursing Home Inc. Statement of Income Year Ended December 31, 2018 Revenue Resident services revenue Provision for bad debts Other revenue Total revenues $3,520,400 (120,300) 150,600 $3,550,700 Expenses Salaries and benefits Medical supplies and drugs Insurance and other Depreciation Interest Total expenses Operating income Income tax expense Net income $1,630,250 990,780 324,622 94,600 160,460 $3.200,712 $ 349,988 120,190 $ 229,798 a. How does this income statement differ from the one presented in exhibit 11.2? b. What is Rio Grande's total profit margin? c. How do you interpret and assess Rio Grande's total profit margin? Use exhibit 11.1, 2016 as the benchmark for the assessment. 2016 2015 Net service revenues $3,996 $2,666 Cost of service revenues EXHIBIT 11.1 Park Ridge Homecare: Statements of Income for Years Ended December 31, 2016 and 2015 (in Thousands) 1,944 2,937 $1,059 Gross profit General and administrative expenses $ 722 649 909 21 15 $ 930 $ 664 Depreciation Total operating expenses Operating income Interest income $ 129 $ 58 89 86 Interest expense 16 19 Total interest income, net $ 73 $ 67 Income before income taxes $ 202 $ 125 Income tax expense 39 26 Net income $ 163 $ 99 2016 2015 $ 150,118 Operating revenues Patient service revenue Less: Provision for bad debts Net patient service revenue Premium revenue EXHIBIT 11.2 Good Samaritan Medical Center: Statements of Operations for Years Ended December 31, 2016 and 2015 (in Thousands) $123,565 1,800 $121,765 16,455 2,000 $ 148,118 18,782 Other revenue 3,079 2,704 $169,979 $140,924 Net operating revenues Expenses Salaries and benefits Supplies Insurance $126,223 $102,334 18,673 20,568 4,518 3,189 3,710 2,603 Lease 5,798 3,476 6,405 5,329 $166,232 $ 3,747 $136,594 $ 4,330 Depreciation Interest Total expenses Operating income Nonoperating income Contributions Investment income Total nonoperating income Excess of revenues over expenses (net income) $ 243 $ 198 3,870 3,678 $ 4,113 $ 7,860 $ 3,876 $ 8,206 Problem 1 Entries for the Boston Clinic 2018 income statement are listed below. Use the data to prepare a properly formatted income statement. (Hint: See Exhibit 11.2.) Depreciation expense General/Administrative expenses Interest expense Nonoperating income Other operating revenue Patient service revenue Provision for bad debts Purchased clinic services Salaries and benefits $110,000 84,000 18,500 50,200 24,600 640,400 60,000 120,800 210,000 Boston Clinic Income Statement Year Ended, 2018 Revenue Patient service revenue $640,400 Provision for bad debts $60,000 Other operating revenue $24,600 Total Revenues $605,000 Expenses Salaries & Benefits $210,000 Purchased clinic services $120,800 Depreciation expense $110,000 General/Administrative expense $84,000 Interest expense $18,500 Total Expenses $543,300 Operating Income $61,700 Non Operating Income $50,200 Net Income $111,900
Step by Step Solution
There are 3 Steps involved in it

Get step-by-step solutions from verified subject matter experts